Hi,
how can I find the optimal epsilon for DBScan.
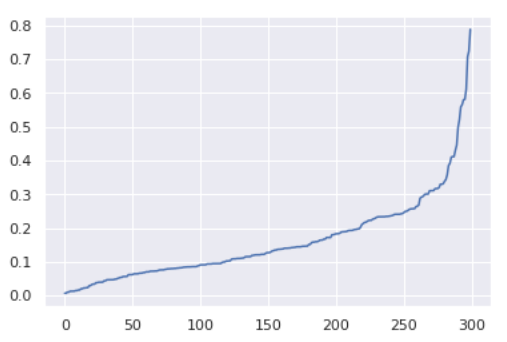
I tried some eps’, but I want a curve to see the elbow or knee like this
Hi,
how can I find the optimal epsilon for DBScan.
I tried some eps’, but I want a curve to see the elbow or knee like this
Currently you will have to build a loop iterating over your possible values of epsilon and however you classify the “goodness” of your results.
You can use the Silhouette Coefficient node to plot vs clusters for instance.
You can use the Similarity Search node to find nearest neighbors for each data point (e.g. min points) and then calculate the average distance between each data point and its neighbors. Then sort based on the average distance and use Line Plot to visualize data point and distances (x axis → data points, y axis → distance). There you may find an elbow to use as your epsilon value.
@victor_palacios
I don’t think Silhouette is a good quality measure for DBSCAN. Silhouette assumes convex clusters, but DBSCAN does not generate convex clusters.
![]()
This topic was automatically closed 90 days after the last reply. New replies are no longer allowed.