Dear all,
I am rather new in machine learning and I need to use knime to apply a machine learning algorithm to a certain dataset for a univeristy course. Such dataset reports death in USA in 2005, specifying variables such as sex, size of the city of residence, age range, cause of death and a column named “count” which indicates how many instances of deaths with such features were there in 2005. So each row represents a bunch of people having same sex, living in a same-size city… etc, died for the same reason. What I would like to do is to train the model so that it can tell which group of people will die because of suicide and which beacuse of accident/illness. In facts, given that I know cause of death, I could create a dychotomic column (yes, no) indicating if that group died suicidal or not. Thus this dychotomic variable will be my dependent variable and sex, size of city, race and count will be my independent variables.
What I would like to ask you is if there’s a way to tell to a Naive Bayes Learner, either by knime or Weka, that “count” is not simply a continuos variable, but it is rather a count of how many instances are there with those same features. Is there a way? May you suggest me which might be the right learner node to perform such training?
Thank you very much
Hi,
Does it solve your issue if you simply convert the column type of “Count” to string?
So the Learner treats the “Count” as a nominal similar to the other column types.
Best,
Armin
Dear Armin,
I am not sure. I may be wrong, but I believe it to be important that there are exactly say, 50 cases in a row and just 2 in another. I believe that the classifier should consider the evidence that the former row is a group which is bigger than the latter, in order to assign probabilities to new cases in a test set. In my mind, it is as if that 50-cases row shoulg weight more than the 2-cases one in the training phase. What do you think?
Thanks a lot
Elena
I think you can use the columns freely as Naive Bayes considers each column separately so I guess you don’t need to worry about the difference in the number of nominal values.
However, I’m not sure if I’ve got your question well and if my answer is correct, So I ask a KNIME team member to review.
Would you please @ScottF?
Best,
Armin
I think you have to establish what is the base of the population of each combination or you might derive some relative number from the data itself but that might only be relative to all deaths. The target might be a % of death probability for reason of death.
Age 18-25, big city, male => % of death by suicide in comparison to all persons 18-25, big city. You might then adapt the result to a new population of that characteristic. That might or might not be a machine learning question, it might simply be an adaption of percentages.
The only other possibility if you do not have the basics numbers of said populations would be to derive some ‘relative’ death by suicide risk from all mentioning of Age 18-25, big city, male in comparison to all other forms of death. Young men in big cities are xyz more likely to die of suicide than other forms of death.
It would be good if you could provide a sample dataset or the dataset itself so we might discuss with some real world data.
Dear mlauber,
that one is my dataset. I think that I have the information about the base of the population in population column. Thanks a lot
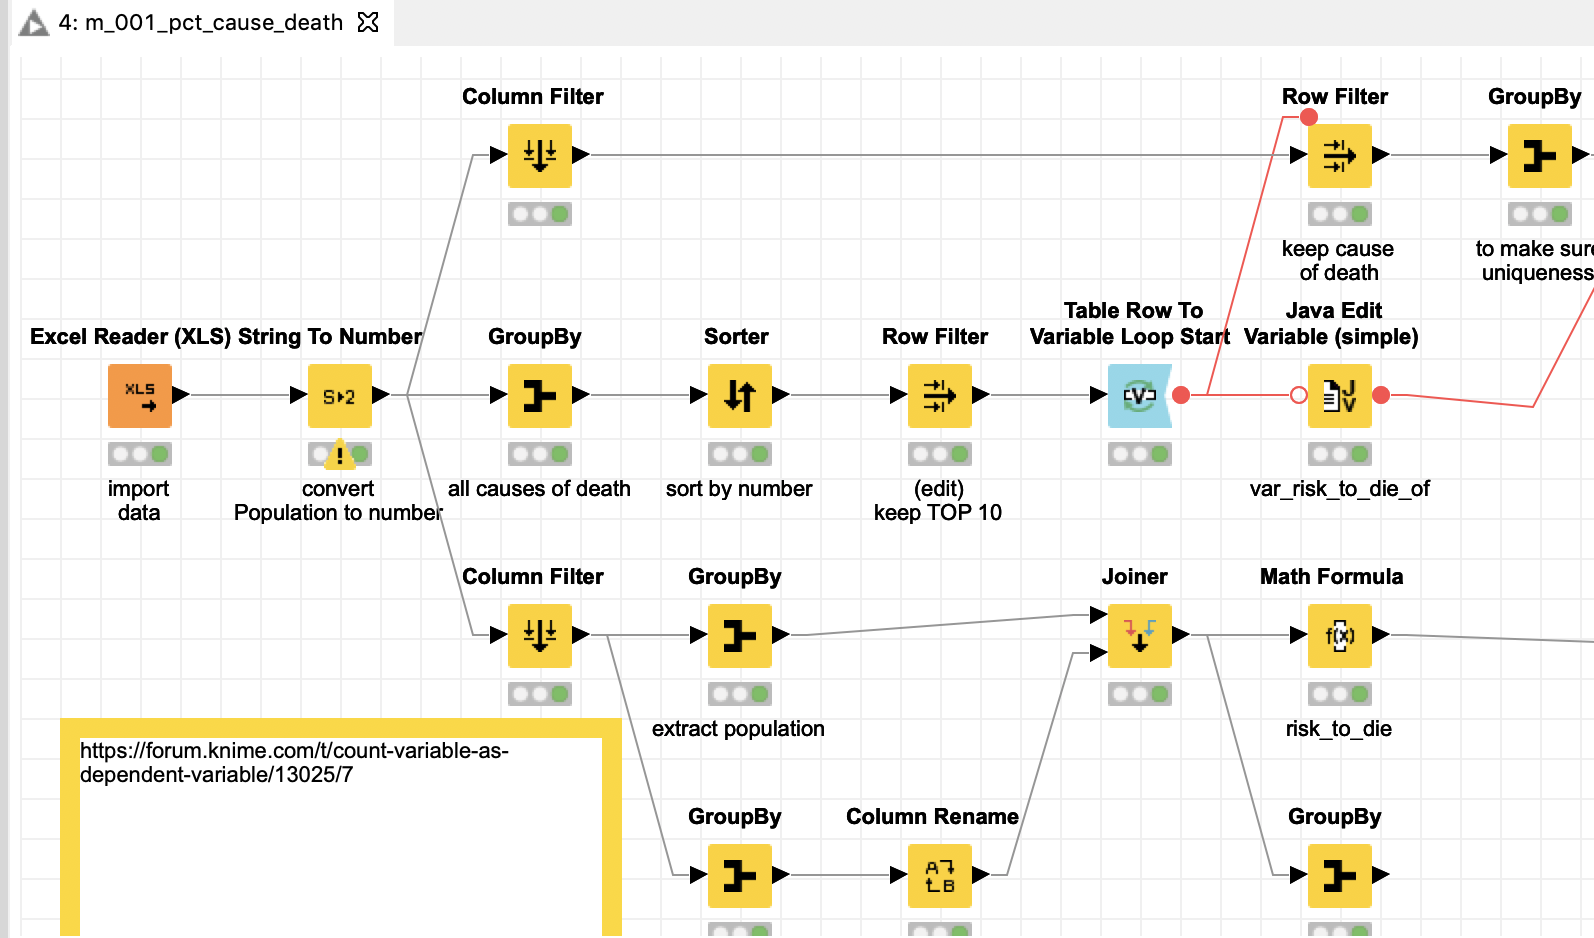
I attached a workflow where I tried to extract and bring together some information and show my line of thinking. You can determine the structure of the 270 Mio. people in the US in 2005 from the data. You could then calculate a mean risk of death for every demographic group. Then I take the 10 largest reasons of death and compare them to the average of every group and across all groups. I use an index where 100 marks the highest risk of death overall, which is white males over 85 in rural areas (that does not mean all of them will die instantly, but they equal the 100 in the index).
You might then compare the other demographics relative to that and try to interpret structures. And also you might have to check you data, since it might be that American Indians and Alaska natives are that much healthier then other people or the data might have a problem.
Depending on your task you might use the % risk of death without the index and try to interpret that. One problem is that the numbers for the following diseases are quite low so some numbers might become very small.
The example uses the TOP 10 diseases. You might use more and then calculate a relative risk of dying from some diseases over a row.