Need idea in cluster analysis problem

Hello community,

Iam new to Knime and to data mining and I am currently stuck on some data and I dont know how to continue. Here is my problem:
I have a dataset of upcoming machine events which are stored into an excel file. Every time an event happens the event will be stored into the file with an “event name” and “timestamp”. Sometimes an critical error occured and my problem now is that I want to analyse the last events happened before the critical error came.

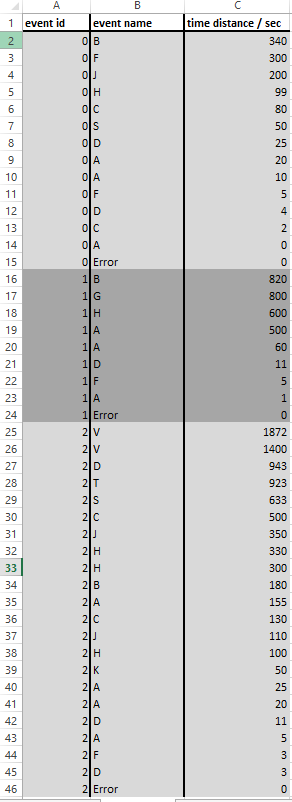
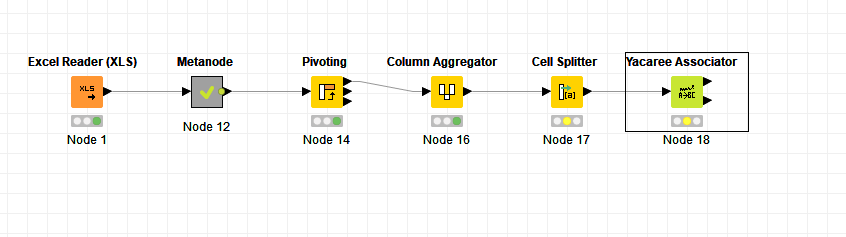
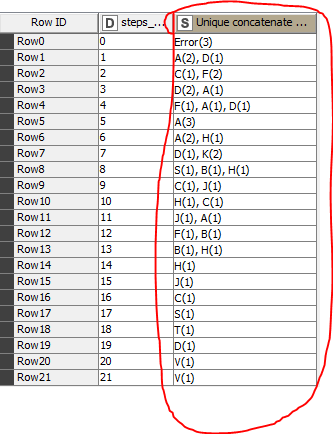
I already built a preparation workflow for my input so my data will be filtered down to 3 columns of “event id”, “event name” and “time distance / sec”, where “event id” is the ID of the corresponding event of the error, “event name” is the name of the event like in the input file and “time distance / sec” is the calculated difference of the timestamps from “error” to every other event happened before. Attached you will find a sample table of the filtered data with the 3 columns.

My idea now is to maybe do a hierarchical clustering so I can see which group/series of events happened every time right before an critical error occurred and therefore which events might be more important to look into and which not.

I hope you guys have an idea of my problem and you might give me a hint how to continue with this. If you have any question for understanding my problem please let me know.

Have a nice day!

Greets,
Tim

Hi @Tim991

reading your case I think you should consider to use error-events and non-error-events (if available!) in your analysis, because you want to know which (combinations of) events are more important to look into and which not.
Otherwise you may conclude that a pattern you find that cause the errors, is also responsible for the same number of non-errors. :thinking:
If you have enough error-events and non-error events you may consider to do a classification model (e.g. simple decision tree to start with) and see what features are important.
Create features for every step in your proces. Last step before error/non-error is 1, the second step =2 etc. See example. You can create even more features by making combinations of events and time or the event trailing/leading another event, be creative.

Possible features
error_or_non-error
1+Mean(time_dist)
1+First(event_name)
2+Mean(time_dist)
2+First(event_name)
3+Mean(time_dist)
3+First(event_name)
4+Mean(time_dist)
4+First(event_name)
5+Mean(time_dist)
5+First(event_name)
6+Mean(time_dist)
6+First(event_name)

Hope this helps,
Hans

2 Likes

Three approaches come to my mind that might help.

First is to try out several Association rules either with a Target (error) or without. It might help you detect typical patterns that occur and might lead to an error. If you only include events that lead to an error you have something like a classification of errors (but not a distinction between errors and non errors). This could help you explore and get more insights.

The results might look something like this. It is similar to a Decision tree

KNIME has an association rule builder (Yacaree Associator) where you could turn your sequence of events into groups of things happening before a following sequence of events - could be useful if you want to see what happens after the error - if you have that.

You could read the description and see if different settings might help you. You will have to transform your data into a flat format.

Then you could think about treating the sequence with the time intervals between the events as a time series and see what you can do about it. But that is just a rough idea with no particular node or technique in mind.

If you could provide us with a meaningful dummy file we might try and set up a workflow.

3 Likes

Hey @HansS and @mlauber71. Thanks for the answer, I wasnt prepared for such a quick response!

@HansS: All of the events (for example B, F and J) are error events, maybe I should describe this better. I want to analyse which error events (for example event A, C and D in the event id 0) caused the critical error named “error”. Therefore all of my listed events could influence the trigger of the event “error”.

@mlauber71: I tried some of the association rules but most of them need non-numeric input values and my “time distance / sec” is measured in numbers.

Attached you guys will find my dummy input file with 5 critical error events (“event id” 0-4) where every event id has a different number of error events occurred before the event “error” happened. The event “error” has the value 0 for “time distance / sec” every time because this should be the point zero in every id group for measuring the time distance. I think the event “error” should be filtered from the input because we dont want to analyse the critical error, but the other ones which caused them.
SampleData.xlsx (11.8 KB)

Thank you so much!

Greets,
Tim

3 Likes

@HansS and @mlauber71 you have some idea how to start with my SampleData.xlsx as an input?

Have a nice weekend!

Greets,
Tim

Hi @Tim991
I think this a complicated question to answer (for me :smile:
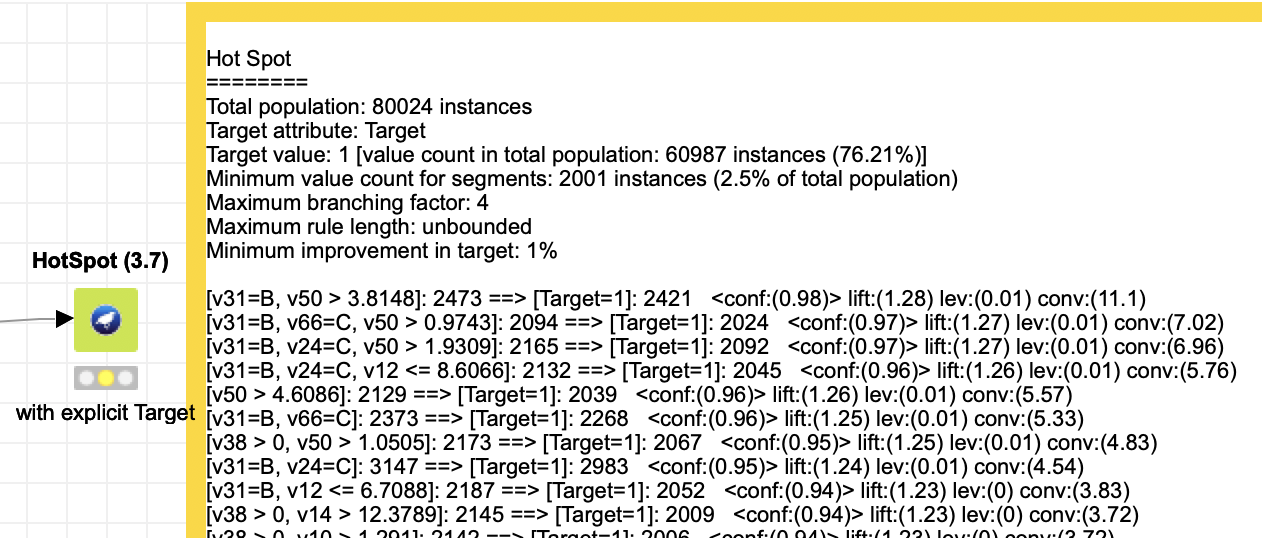
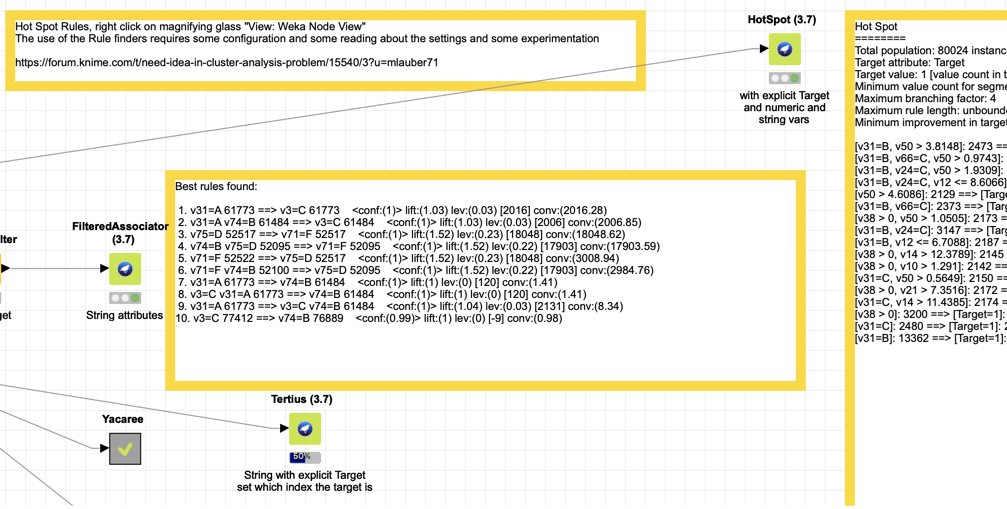
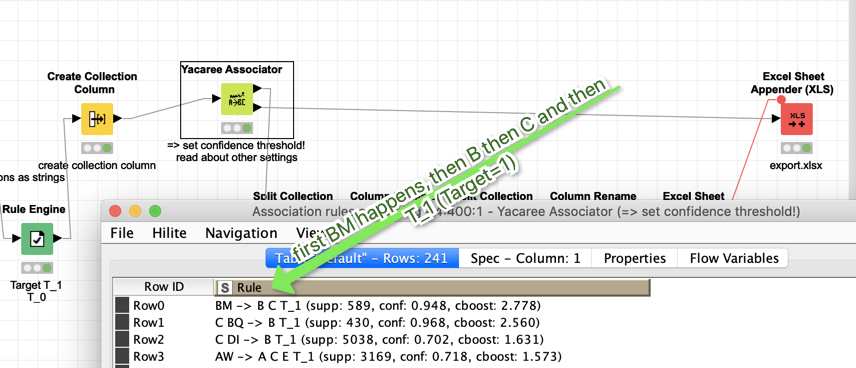
) . You have a sample file with multiple (5) events. All events are ending in an error. Every event consists of a sequence of errors (event name) and the time before the “critical” error occurred. Now you want to know which event name(s) is/are responsible for the critical error. @mlauber71 suggested an association rule solution. I created a wf that creates a set that you can use as an input for an association rule learner.need_idea.knwf (42.7 KB)

Nice weekend!

Hey Hans,

you have understood my problem exactly! Thanks a lot for the file, I will have a look into it tomorrow and will response here.

Have a good night/day :slight_smile:

Tim

Hey Hans,

your workflow looks promising, thanks a lot! But when I want to add the Yacaree Associator I will always get an emty output table. Here is a screenshot with your wf and the added node:

Unfortunately I cannot find a good documentation for the Yacaree Associator so I dont really know what to change in the input so it will put out something useful.

Anyone who already worked with this node can help me please? The output in the console is: WARN Yacaree Associator 0:18 Node created empty data tables on all out-ports.

Greetings,
Tim

He @Tim991

I have never seen the Yacaree Associater but when I read about it in NodePit it said Connect it to a Create Collection Column node - preferably with “set” option checked.
The Column Aggregator Node in my example returns a list. So that’s maybe why your Yacaree Associator created empty data tables on all out-ports.
gr. Hans

Hey Hans,

I still couldn’t use the Yacaree Associator but I have a different idea I want to try. I changed a node in your wf and now I get this output:
output_count
Now I need some node to get the event name (f.e. A or D) of the red marked column with the maximum counted value. For example in Row 1 it would be A, in Row 2 it would be F, Row 3 its D and so on. For the case that there are two or more of the same counted value (f.e. Row 4) the resulting output should be one of them.
I tried to find the maximum value of a row withing the column aggregation node but the result for a string is always the maximum letter withing the alphabet and not the one with the maximum apperance.

Attached you will find the wf, the input excel is the same like before
need_idea2.knwf (15.6 KB)

Have a good sunday!
Tim

I think I already found the the solution for counting the event names withing the column aggregation node:


Iam not quite sure about the option “mode” because there is not description but as far as I see this option gives the maximum event as an output …

output_with_mode

However, if somebody have worked with the Yacaree Associator so far and can help me about my input problem I could try this method too.

Have a good day!
Tim

I have tried the few lines but they do not make that much sense and for the Weka nodes I had in mind they do not have the right format. So I used an older example I had from a Kaggle DS. It is just for illustration the values do not make much sense with regards to a sequence.

These basic differences

Weka HotSpot can deal with strings and numbers and would accept a Target (in your case if you want to differentiate between Errors and Non-Errors). This might potentially handle your duration values.

Tertius would work with strings and you could or could not set a class (Target).

GeneralizedSequentialPatterns allows to specify a sequencing ID, you might be able to use your data structure with the event_id

PredictiveApriori and FilteredAssociator are additional methods; please read about their capabilities I am not an expert in that regard.

Yacaree is special in two regards: it does not use the variables with the Var-Name and then the value but just the sequence of values that have to stand for themselves, and it considerers sequences before and after - from a few experiments it might be that it is influenced by the different number of events that might lead to an Error; could be it works best with a fixed set of sequences

All this nodes have quite some possibilities to configure them; typically some threshold for confidence (reliability of the rule), some minimum coverage (a rule only applying to a small set might be skipped). Please read about the implications and bring them together with your data. Toy around with them and gain experience.

From my perspective these nodes could help you to gain more insights; they are not a magical tool to answer all your questions :slight_smile: but more a starting point.

Yacaree might look something like this:

Maybe someone with more experience in Rulesets can weight in. And you might provide us with a larger sample to have something that is actually interpretable. Also maybe someone can provide a useful example data set to toy around with.

Please also note. These nodes might need quite some calculation power especially if you have large data sets.

m_120_weka_hotspot_and_yacaree_rules.knwf (780.8 KB)

1 Like

This topic was automatically closed 182 days after the last reply. New replies are no longer allowed.