@Onuran what you can do is import the data and start exploring. There are two useful Python packages “pandas-profiling” and “sweetviz” that you could use to start exploring.
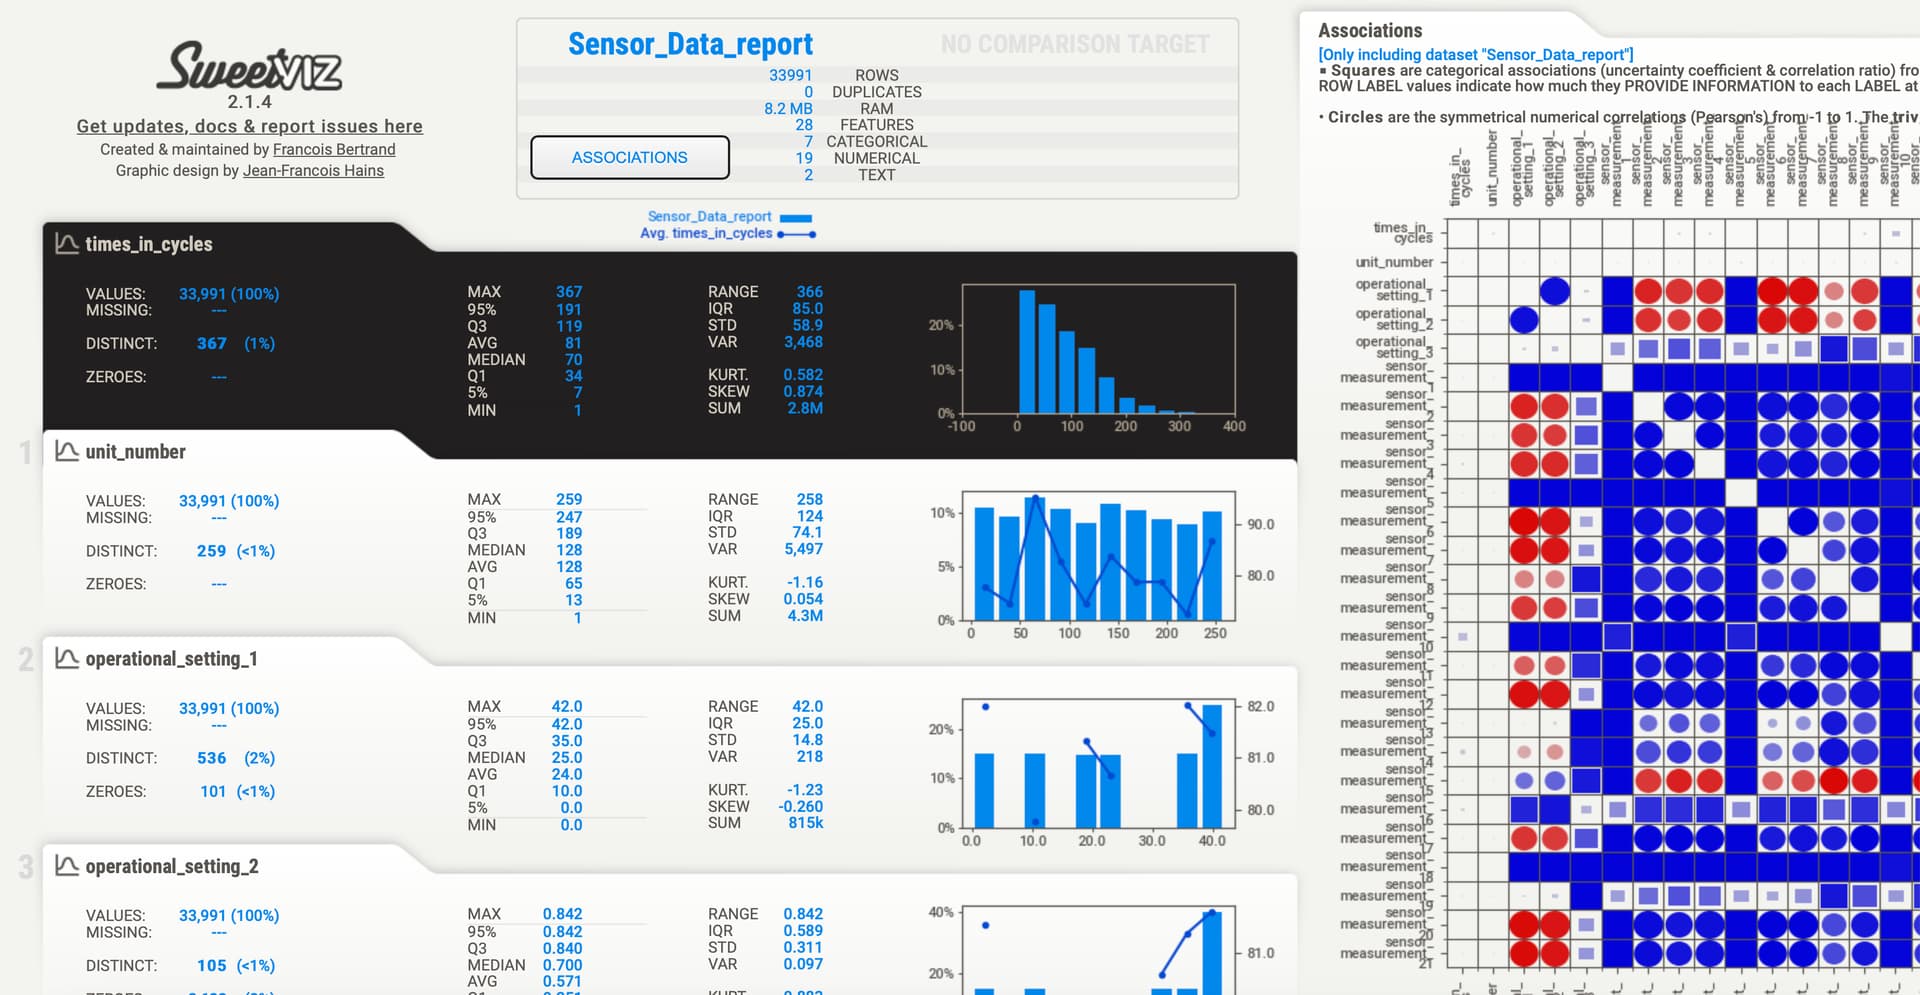
The “times_in_cycles” has a maximum of 367 which sounds like maybe days in a year but might be something different. The numbers have a strong leaning to the ‘left’ so only few cycles reach larger numbers. There are various correlations between the measurements that might have to be explored, also what it is about the operational settings and what their relationship is with the times.
Some measurements only have a few values so they are considered categorical.
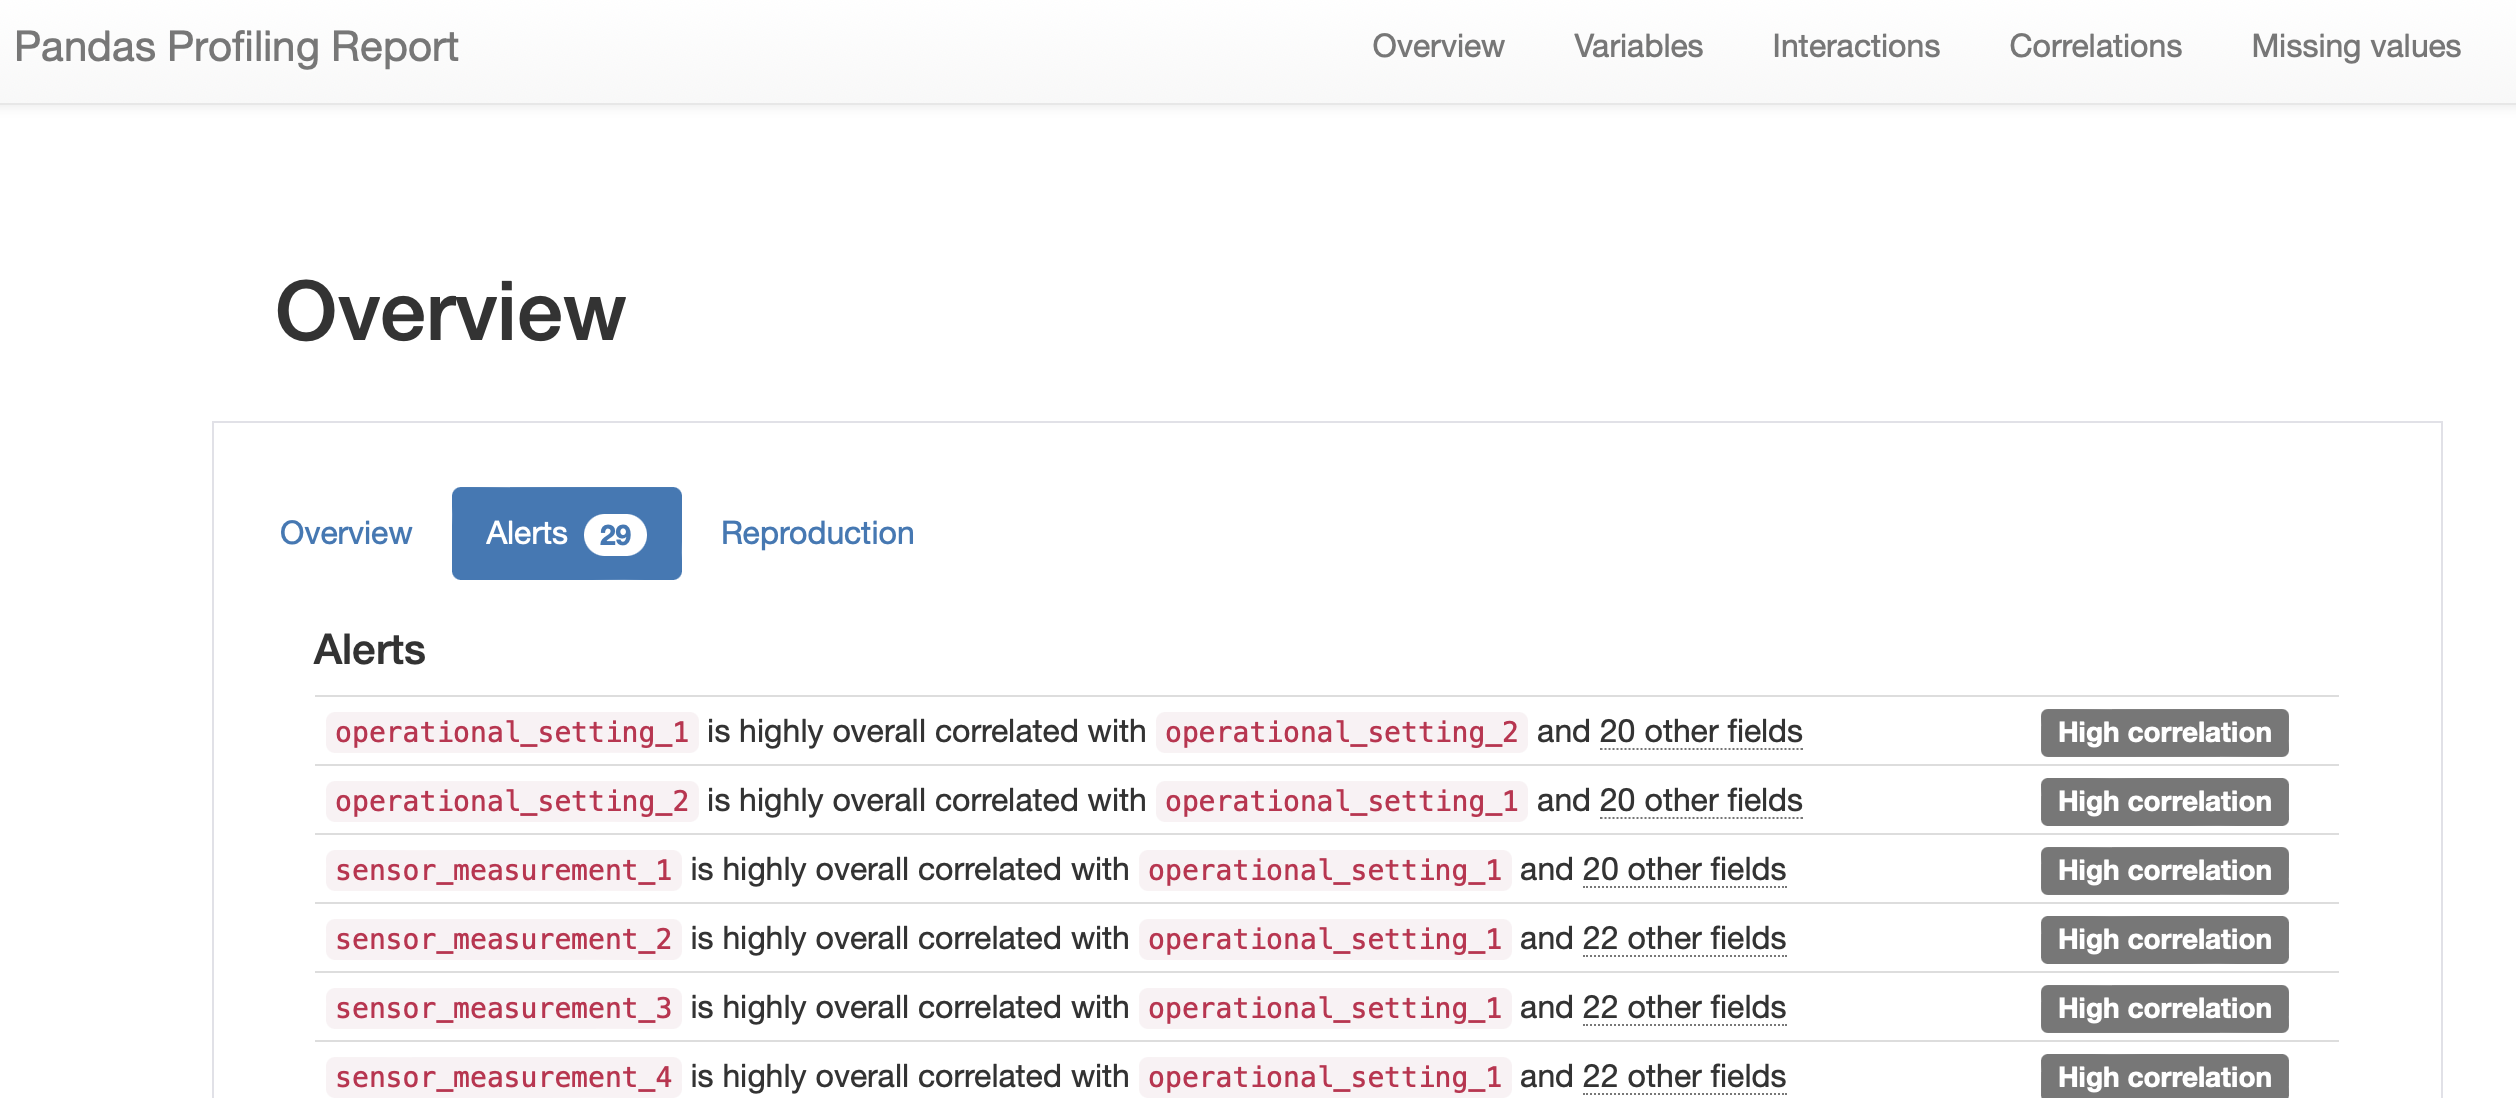
The Pandas Profiler offers further insights, like that the sensor data (and settings) seem to be highly correlated (which might be expected if this data is indeed sensor data).
The code in Python would look like this
import pandas as pd
import numpy as np
import pyarrow.parquet as pq

import pandas_profiling
import sweetviz as sv

# the data path
v_parquet_path = "sensor_data.parquet"

df    = pq.read_table(v_parquet_path).to_pandas()

# Generate a report
report = pandas_profiling.ProfileReport(df)
report.to_file("report.html")

# use Sweetviz
report_sv = sv.analyze([df, "Sensor_Data_report"], target_feat="times_in_cycles")
report_sv.show_html()
You will find the imported data here. In the “/data/” folder of the workflow you find the reports.
If this is some sort of assignment these remarks might help you on the way. You might want to clarify what the task is (is it the exploration) and what the outcome is. To know what you can do and what methods to use might very much depend on your data.