You are welcome @Reinhard-Korn
Comments:
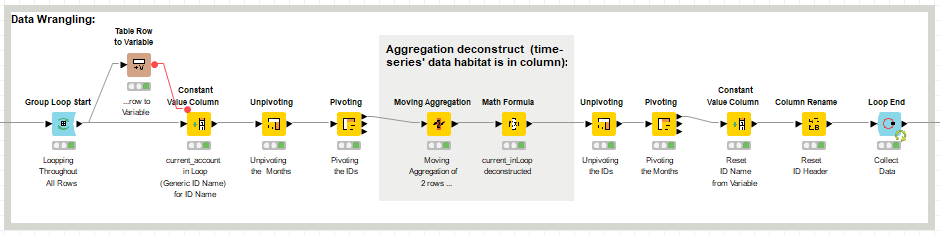
1- I’ve replaced the Column Rename node from your download with a Constant Value Column node within starting the loop, as it is more simple to configure for a variable.
2-The real solution is implemented in the 2 shaded nodes in the figure.
The approach you mentioned in your post by operating the months wasn’t right. Despite that you visualized the data in columns, the data habitat for a time series (months) is a column. So in fact you where trying to operate by rows as in an spreadsheet mindset.
BR