How do I calculate the delta of the columns? Changes from 10 to 11 and 09 to 11 and 08 to 11 when the column names are changing and under the condition that the data is based on months?
BR,
Sven
Edit: I know there is a field Column Index, which maybe will solve my problem, but I don’t know how to identify the column by its index.
Edit2: I found this Workflow, but I’m not 100% sure
I’m accessing a table with all sales on every product. Now I like to generate a list of top selling articles and the changes in the last 30, 60 and 90 days.
Example:
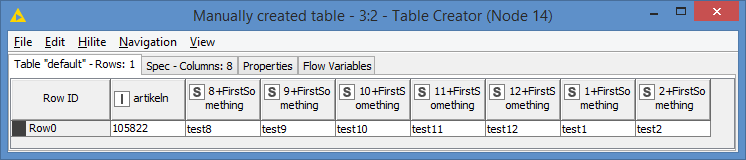
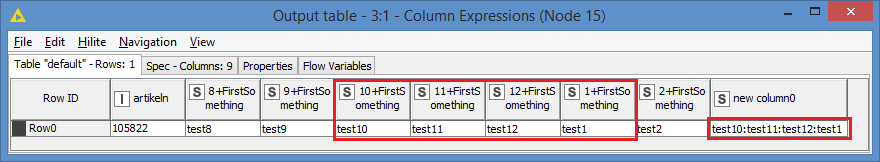
Article 105822
Units sold (total): 16
Last month: 1
Delta 30 days: -5
Delta 60 days: -8
Delta 90 days: -14
I see. But still don’t understand/know how your data structure looks like and column names are changed. Can you explain it a bit more with data input and output?
the column names change because they are based on month by number.
so in january the table will look like 9/10/11/12
in february 10/11/12/1 (i hope this will work)
Hi @sven-abx,
the math formula (multi column) node has also the option to use static and variable ($current column$) columns. With the enforce exclution option you are able to keep the node flexible.
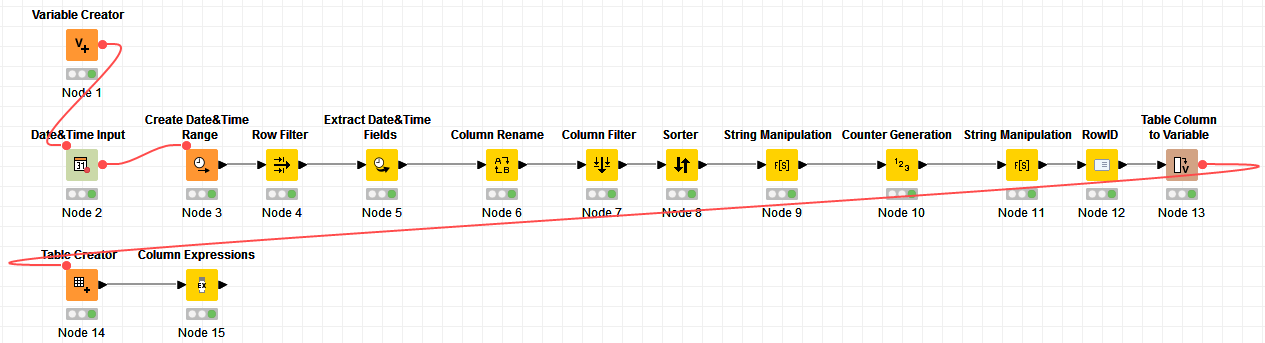
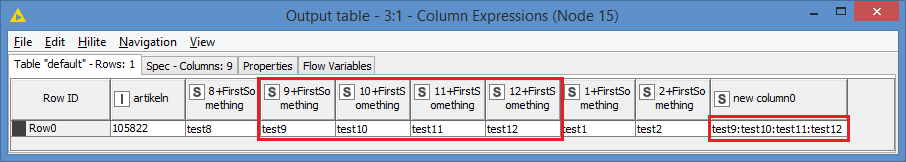
Hi @sven-abx , I put something in relation to your last comment
Since I don’t have a good sample data from you and I don’t know how you are doing your calculation, I put something together that shows how to access the columns dynamically. You can adapt it to your use case. The workflow looks like this:
I’m not 100% sure but my intuition tells me it will be much easier if you have the data in “rows instead of columns” eg. duplicate aritklenr. and then a sales column and months column (=constant column names). Then you sort on artikelnr and months ascending and use 3 lag columns to calculate differences.
thanks for your reply. first i was thinking to do it the way you describe, but then i fiured out, that it is possible no sales happend in a month and this month is then missing.
hi @bruno29a,
thanks for your reply, i will give it a try.
@ipazin maybe this helps to clearify what i like to do:
i want to calculate the changes (delta) in sales from 30, 60 and 90 days to today.
example: in november (11) 1 item of this article was sold and in october (10) 6. so sales decreased about 5 items.
the difficult thing is: the column names can change, because the workflow is executed once a month and loads the data of the previouse months. on the first of december i fetch tha data of november, october, september and august. in january december, november, october and september and so on.
I do understand the logic but don’t know how your input data looks like, whats output format you want and are only column names changing or also number of columns is changing. Without that we can only guess…
the values will stay the same. and maybe better the position of the column will change, but not the name.
in the end i like to write the data to a csv-file.
Hi @kienerj , the lag option is a good idea, but the sorting is an issue, especially if you are doing end of last year + beginning of this year.
As per @sven-abx 's example, for February, you would be taking these months: 10/11/12/1. So technically speaking, it should be sorted as 10, 11, 12, and then start over with 1, 2, 3, etc… If you sort, it would actually be 1, 2, 3, …, 10, 11, 12. We don’t see the data to know if there is any value that indicates which year is the months for. If there is some sort of year, then yes, you can sort properly. If not, then the sort would not work.
@sven-abx I think it would be best if you could provide us with an example of the changing names. It might be an artificial one that would demonstrate missing names also.
In any case there will have to be some indication, maybe information in a data row that would give you an indication of a starting or an endpoint and even then if a missing February could either be 6+ or 7+ I guess we will have a hard time coming up with a solution.
KNIME can do all sorts of logics and tricks but if there is no consistent system (how strange it might seem) and no indication it will not be possible.
You might have to talk to your data source since representing important information in such a way carries severe risks of misinterpretation.
Some time ago I created a workflow which is running on a regular base on SAP data (xls export).
After some months I had the problem that the structure of the data changed in terms of columns (same data in other cols).
I solved that by renaming the columns after reading the xls data file.
To allow a type of configuration I’m using a (xls) config file. That file defines the columns to be renamed.
Using that approach I have no need to touch the workflow itself. It is operating on the renamed columns only.
In this case I would rename like
in_xls_file | in_knime_WF
January | month
December | month-1
November | month-2
Hi @sven-abx
Is this topic still alive? I agree with @Daniel_Weikert
I solved recently a related topic, and the solution came in Daniel’s pointed direction.
I think you pivoted the values. You do not need it because you can use “the lag column” node.
This node picks value from a previous row and pull over the actual row.
Just take care about the order…your values should be ordered by date or by an index, hence I suggest to use a “sorter” node before lagging the column.
Once you did it use a math formula or a column expression to get delta.