This workflow shows the steps involved building a cohort chart.
The first step is to split contracts data into recurring values.
The second step is to build a cohort chart from the recurring values.
In this example, the cohort charts show the annually recurring revenue (ARR) and customer count by time and time-based cohort.
Other metrics can be visulaized by reconfiguring the shared components.
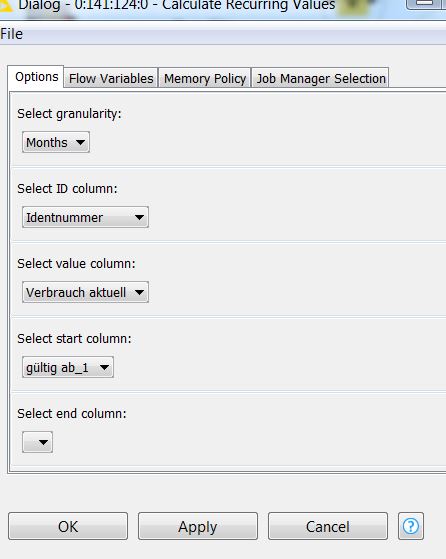
i have aquestion about the component “Calculate Recurring Values”
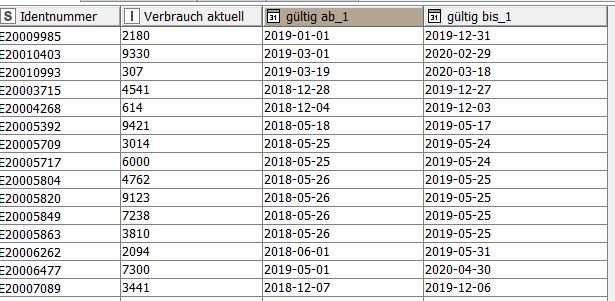
I have the following data:
I would like to build a time series with the “Calculate Recurring Values” component.
Unfortunately i am not able to select the column “gültig_bis_1” as the “end column”