Correlation between two channels - Image analysis

Hello,

I have images of nuclei with specific ROIs where I want to look at colocalization of two fluorescent probes. Is there a way to get Pearson Correlation and Manders Correlation Coefficients between two channels in KNIME?

If I have to calculate the correlation manually, I would need intensity values from each pixel at each position in the ROIs for both channels (eg. table with each row being a position/pixel, with column1 being intensity from channel 1, and column2 for channel2). But I don’t know how to get information from each pixel…

Thanks
Christine

Hi Christine (@yoyo1130),

there’s no KNIME native solution to calculate Pearson’s Correlation I’m afraid…

But: Scripting nodes to the rescue! Are you familiar with Python? Given you have set up python, that’s what I’d use, as in this example:

I’m not quite sure how you want the ROIs to be taken into account - do you want one correlation coefficient for each ROI? I suppose you would use labels for that, so I guess you could apply these labels in the python script node as a mask?

Hope that helps!
Lukas

3 Likes

Hi Lukas,

Thanks for your reply - I’ll try out the workflow! Unfortunately, I am not familiar with Python :frowning: , but I’ll see if I can figure it out.

Yes, I would like a correlation for each ROI, which ideally would be the area of overlap between the two probes in each cell. I’m currently trying to see if I can crop images of my two channels using my segments/ROIs (Segment Cropper) → use Splitter on X to get slices → Image to DataRow to get string of values for each X coordinate → Ungroup and Unpivot to get table with XY and values

Then inner join the tables from the two channels, and filter out rows/coordinates are that zero in both X and Y columns, in both channels.

Do you think this would work? I’m not done with this test yet, and so far I’ve already encountered some problems.

  1. When I split my Image column (contains ROIs) with Splitter along X, it only outputs 4 slices. I wonder if it’s because some ROIs are much smaller, so the table only outputs the minimum number of columns/slices, in order to keep the table “even”. Because when I only do it on one ROI (one image), there are definitely more than 4 slices. Can Loop help, ie. if I could process each row/ROI separately, then concatenate the tables at the end?

  2. Would I be able to carry my Labels through this process, ie have a label column next to my XY and value column in the final table?

  3. The Segment Cropper doesn’t always crop out individual segments. I get some images that contain more than one segments. I assume there’s no way to make it crop only one segment? What ended up happening is some segments are counted twice…

Thanks!
Christine

2 Likes

Hi Christine,

I think I can not follow on your proposed method exactly without some example data :wink: It might actually be that your labelings will get lost along the way… But could you share some (dummy) data?

(In the Splitter configuration, beware that in the “Dimension selection” you choose the dimensions that will stay together, i.e. you want X and Y to be selected to split along the channel - that confused me initially.)

If all you want is the overlapping area of the labellings, I’d suggest another method: you can

  1. convert the labelings to images,
  2. project the channel down (Projection Operation: AVG_INTENSITY) - overlapping ROIs will result in increased intensity
  3. take a global threshold to get the maximum values, which represent the overlapping areas
  4. sum up the pixels to get the the number of pixels of the overlapping areas,

Like so:


as here on the Hub:

Could that work for you?
Best, Lukas

3 Likes

Hi Lukas,

Sorry I know this is confusing… hopefully this would be clearer?

The goal is to calculate a Pearson Correlation only in the overlap between two probes, so I would need to obtain XY and intensity values from both channels and do a correlation analysis. However, an image contains many cells, and I would like to do the correlation analysis separately for each cell, instead of calculating one correlation coefficient using pixels from all cells on the image. So, while manipulating data/image, I need to keep track of labels.

My workflow is quite messy right now…not sure if there’s a way to share just the relevant section of the workflow…

Currently I have a table with images of channel 1 and channel 2, and a segmentation column with the ROIs. I used the Segment Cropper to crop channel 1 and 2 based on my labeling column. One problem is that Segment Cropper doesn’t always crop out single segments; sometimes the resulting cropped images contains two ROIs…maybe because the ROIs are close together?

After the Segment Cropper node, I have a table of cropped images (ideally of each ROIs) and the label column. The idea to use Splitter on X and Image to DataRow is really to get XY coordinates with intensity. I thought of using this because of this post: Extract pixel values from pictures
Problem I encountered here is that, when I split across X, I only get 4 slices, which means I only get 4 Y pixels along the X (dimension of 4 pixel on the Y axis). However, some ROIs are definitely bigger than that in terms of XY dimensions, so I wonder if it’s because some ROIs are really small, so the table only output the minimum number of columns to keep the table ‘even’. Otherwise, I should have gotten different number of slices for my different cropped images/ROIs (different sizes); the smaller ROIs would then having empty columns for the non-existent slices. If my table only contains one cropped segment, Splitter along X would give the right number of slices.

I haven’t learned how to use Loop, but I wondering if it could help with my situation here. If I could process each row/ROI separately, maybe I could get the right number of X slices for each ROI.

2 Likes

Hello,

Just a quick update: Chunk Loop is helping with my issue on getting XY coordinates and values from cropped images of various dimensions.

2 Likes

Hi Christine,

first of all, sorry for the late reply!

I’m glad to hear that the chunk loop is working.

As of why the segment cropper won’t crop out single segments only: is this the case when the ROIs are overlapping? You could check that by appending such overlapping segments in the “Segment Label Filter”-Tab:
image
Maybe you can come up with rules on how to handle these cases?

For sharing workflows: You can try and copy the relevant part of your workflow to a new workflow and upload it to https://hub.knime.com/ (if it does not contain any sensitive data, otherwise probably a single example image & labeling will be enough) and share the link here. Make sure to upload it in an executed state, so that the data is sent along (or save the data in the workflow data area). I’d be glad to try things out with some data at hand :smiley:

Best, Lukas

2 Likes

Hi Lukas,

Thanks for your reply!

The ROIs aren’t overlapping. Example: image

The two labels shown in the picture belong to the same nucleus, but for some reason the cropper doesn’t separate them. Most of the time, the cropper does crop out single ROIs though.

Ok so I tried uploading a workflow and hopefully the link works: https://kni.me/w/hLmXtvCpnBcfmyFn
The workflow uses Segment Cropper and goes through a Loop to get XY coordinates with signal intensity. After the Segment Cropper, you can see that some segments are cropped together even though they’re not overlapping. Also, I don’t understand why the result table shows some cropped images that don’t have both Nucleus and mark labels, since I thought I already specified in the rules to have both labels.

Thanks
Christine

1 Like

Hi Christine,

it looks to me as if the labelings include both blobs - maybe you can try and redefine your labelings, so that each segments has its own labeling. As the images look well prepared, a “Global Thresholder” followed by an “Image to Labeling” node might do?

The Link does not work, unfortunately… maybe you uploaded it to your private space? To that I wouldn’t have access. Could you try again and put it to your public space?

Thanks and Best,
Lukas

1 Like

Hi Lukas,

The two blobs actually have different labelings on the segmentation column, so they should have been cropped separately I think.

How about this: Segment cropping & XY coordinate intensity – KNIME Hub

Thanks
Christine

1 Like

Also, I found out that Segment Cropper duplicates my segments ie. it duplicates the row. I noticed that the each duplicated image has identical dual labelings, but in different order. For example, some cells have Nucleus#;Mark# labels, and some have Mark#;Nucleus# labels. And in the output of the Segment Cropper, one row would have Nucleus_1 as the Label, and Mark_1 as the DependedLabel, while another row would show Mark_1 as the Label, and Nucleus_1 as the DependedLabel. But in reality, those two rows are identical cropped image.

Is there a way to solve this problem?

Before Segment Cropper, the ROIs do show different order of dual labelings as well. Some ROIs have Nucleus#;Mark#, and some ROIs have Mark#;Nucleus#. Is there a way to make sure the order of the labelings are the same?

Thanks
Christine

1 Like

Hi Christine,

thanks, now I’ve got the workflow. The issue with the Segment Cropper is that it does crop out individual segments, but also includes segments where one nucleus has several marks in there. Lets look at
Nucleus_28 as an example, which has three marks in it:


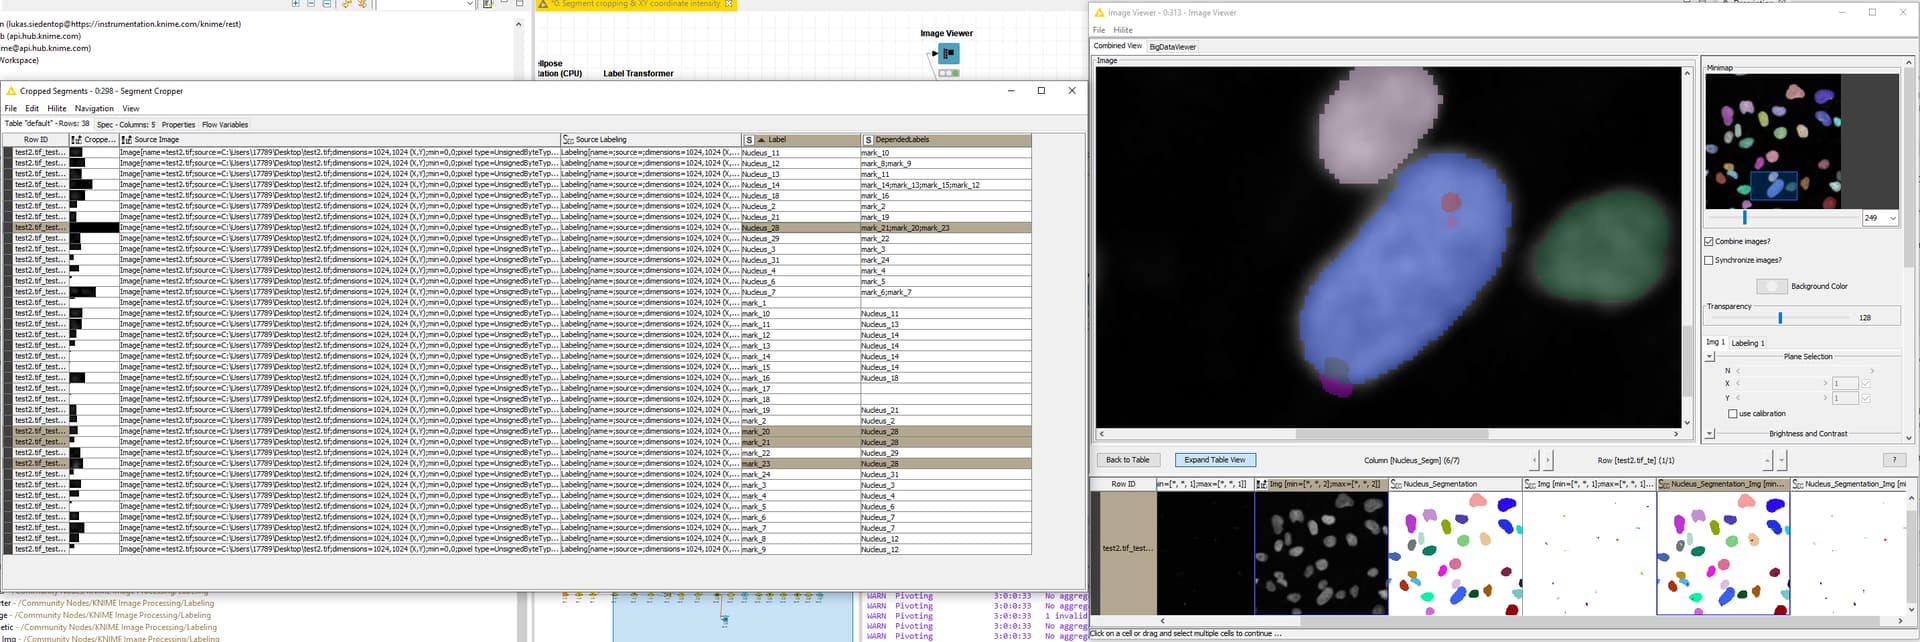
The result of the segment cropper has four entries, one each for the “unique overlaps” (for lack of a better description) and then then one more row with all overlapping labelings. Since the later are separated by semicolons (and you don’t need these non-unique overlapping ones, right?), I would suggest to filter them our with a row filter:

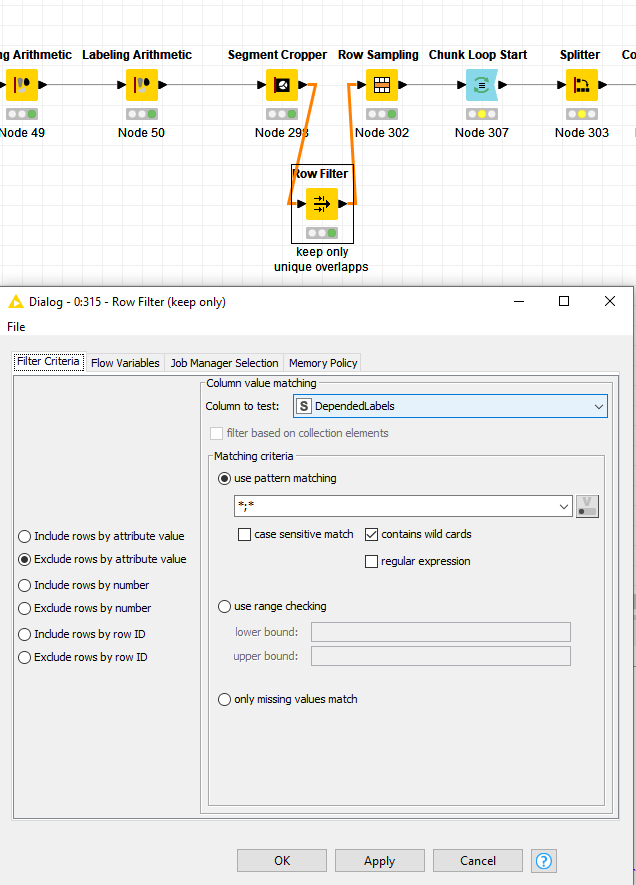
(possibly on the other column as well, if these turn up there as well)

Hopefully this solves one part of the issue, now to the multiple occurrences :slight_smile: Indeed strange that Nucleus_# and mark_# appear twice with different order. I’m not sure whether it would be possible to configure the segment cropper to do that automatically, but a quick check on the example suggests that every pair in the “Label”-column appears in the “DependentLabel”-column:


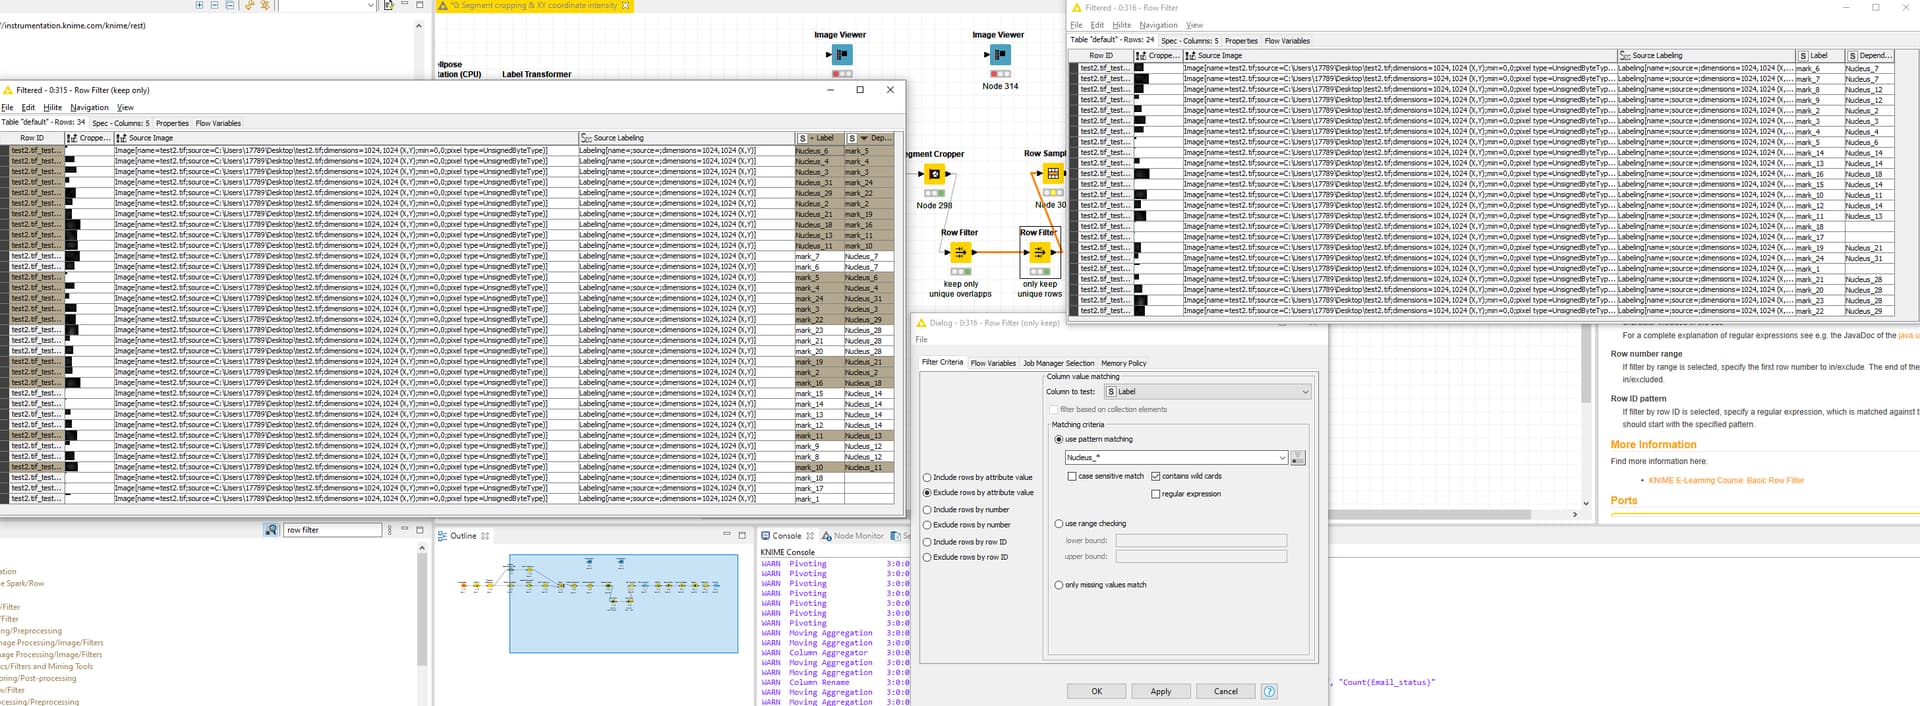
With help of another row filter, we can get rid of these entries as well (you’d need to check whether this is really always the case, not only in this small example. If its not the case, we can come up with something more sophisticated using a few rule engines, I suppose.)

There are also a few marks that lie not in a nucleus (mark_1, mark_17, and mark_18), I guess you want to filter there out as well: You can use a rule-based filter for that.

I think your workflow is great! Looks like you can now do the same procedure with the other channel and go on with manually calculating the correlation coefficient? I think I would do something like the following:

  • Group-By after the loop, with group columns “Label” and “DependentLabel” and mean-aggregation method to calculate the mean of each nucleus
  • Joiner to join back the mean on the “Label” and “DependentLabel” columns to the output of the loop
  • same procedure with the other channel, join both results on the “Label” and “DependentLabel” columns
  • use Math Formula nodes to calculate the coefficient

Or do you have something different in mind already?

Best, Lukas

2 Likes

Hi Lukas,

Thank you so much for checking out my workflow and giving me comments! I will use row filter to filter out the duplicates. I also discovered that there is a Duplicate Row Filter Node, so I tried it on the Cropped Image column and it didn’t work. The regular row filter worked.

Quick question: How did you get the Image Viewer to overlay the DAPI column and the labeling column?

I haven’t actually gotten that far yet into the correlation part, but initially I was thinking correlating the two channels pixel-to-pixel and getting a correlation per cell? I assume once I repeat the same process/workflow with the other channel, then I can join the two tables on Label and DependentLabel, and calculate correlation that way?

So glad the workflow is making sense now :smiley:
Christine

1 Like

Hi Christine,

You’re very welcome :slight_smile: Yeah, the row filter only works if the cells are completely identical, it won’t remove duplicates if cells are swapped…

In the Image Viewer, you can select multiple images (holding down the shift-key) and then select the “Combine images?” tickbox.

Jep, that sounds good to calculate the correlation :slight_smile:

Happy KNIMEing!
Lukas

This topic was automatically closed 182 days after the last reply. New replies are no longer allowed.