Hi @sudhirkumra , a good quick summary of of the process of “normalisation” is described here by @Daniel_Weikert
This aligns with your comment “I need to select columns, deduplicate data to create Dimensions”
I’d imagine that if you had a spreadsheet of department and employee info in a de-normalised form…
Dept_Name |
Dept_Budget |
Employee_Name |
Start_Date |
|---|---|---|---|
Accounts |
1000000 |
Alan |
2021-02-05 |
Accounts |
1000000 |
Belinda |
2016-03-02 |
Sales |
2000000 |
Claire |
2020-12-03 |
Marketting |
3000000 |
David |
2017-06-01 |
IT |
50 |
Elgin |
2024-02-27 |
IT |
50 |
Frances |
2016-09-05 |
…You could put together the column filters, duplicate row filters and value lookups something like this:
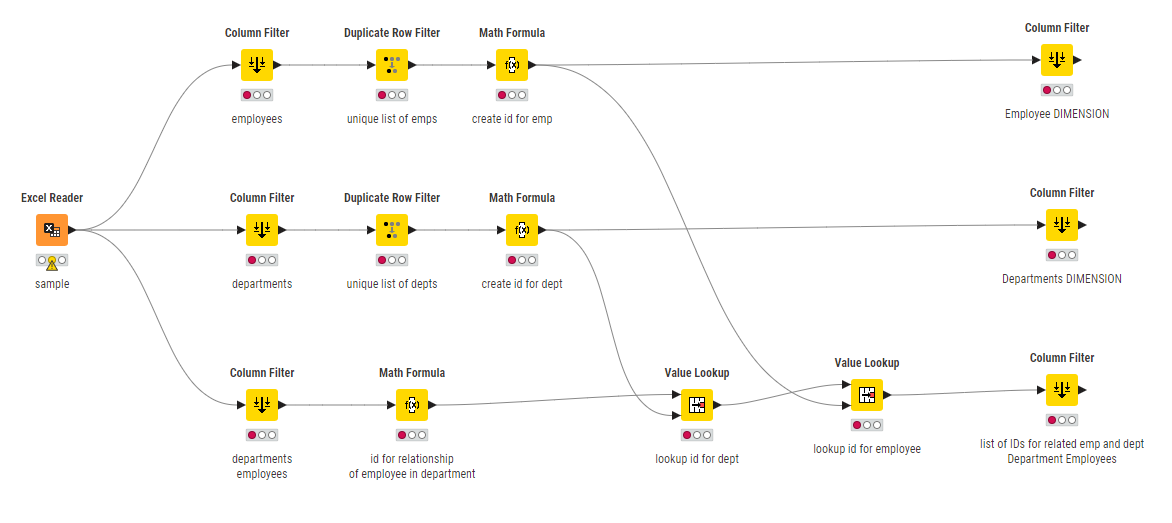
(I’ve not uploaded a workflow as this as it is just a non-functional mockup)
So you’d filter out the columns related to Employees, and separately the columns related to departments. Remove duplicate, and create an id for each. Then back on the “Fact” table, you can apply Value Lookups to get the IDs for each employee and department, and then use column filter to remove the columns relating to Employee and Department other than the IDs
Employee_Name |
Start_Date |
Emp_ID |
|---|---|---|
Alan |
2021-02-05 |
0 |
Belinda |
2016-03-02 |
1 |
Claire |
2020-12-03 |
2 |
David |
2017-06-01 |
3 |
Elgin |
2024-02-27 |
4 |
Frances |
2016-09-05 |
5 |
Dept_Name |
Dept_Budget |
Dept_ID |
|---|---|---|
Accounts |
1000000 |
0 |
Sales |
2000000 |
1 |
Marketting |
3000000 |
2 |
IT |
50 |
3 |
and the relationship between departments and employees, which in this case represents the “Fact” table, although you’d normally have some additional information/columns besides the IDs:
Dept_Emp_ID |
Dept_ID |
Emp_ID |
|---|---|---|
0 |
0 |
0 |
1 |
0 |
1 |
2 |
1 |
2 |
3 |
2 |
3 |
4 |
3 |
4 |
5 |
3 |
5 |
I don’t know what form you specifically need the data to be for working with PowerBI, but this would effectively turn your data into a normalised “relational” structure.