I have the following Question regarding the example file.
I want to find out if different “Countries” use a different “individual Value 2” referring to a common value. My Problem is that there is no common denominator for this value that is specific to the value and the same for different “countries”. So for example I want to find out that England an Germany both use the “same” “Indiviudal Value 2” with Test 2 and Type C but that the “Indiviudal Value 2” varies slightly. On the other hand it is absolutly ok that the values in row 11/12 differ because they are completely different.
I also need to metion that the length of “Indiviudal Value 2” can vary between different types but should be roughly the same between countries for common types.
I really lack an idea how to solve this problem. Many thanks to everyone that might share an idea how to solve this problem.
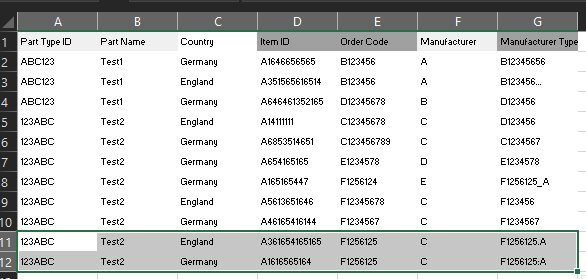
thank you very much for your comment! I have tried the Group By node but its not exactly what I need. To make it a bit more understandable reworked the excel table.
I need to find out, if different countries use the same part but with a different order code. One Problem is, that also the Manufacturer Type can vary dependend on who added it. Knime_Example_V1.xlsx (11.3 KB)
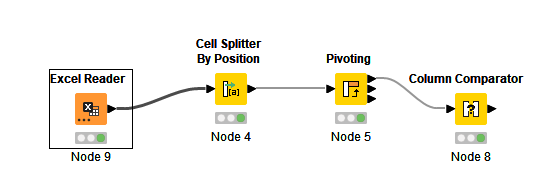
I made the following model in knime:
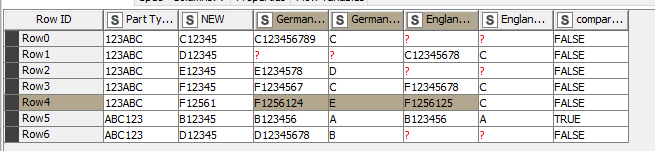
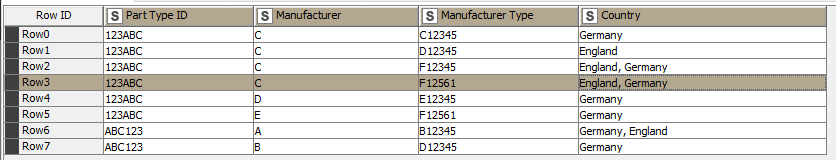
My idea was to first split the Manufacturer Type and only use the first sic digets, so that differences at the end are not relevant. Then pivot the countries with Part Type ID and the short Manufacturer Type as column rows and at the end compare the different country order code columns. This is the result:
My Problem here is that in row four there is a missmatch but in the original table there would have been a match between the countries for this part (row 11/12 in the original table). So in such a case I would like two have two rows in my result table. One that shows the missmatch of the two parts that where almost identical and one that show that there is a match.
The Problem with my idea also comes up if there are two parts at each country that need to be compared but the Manufacturer Type is the same. In my solution there would only be one comparison when theoretically there would need to be four.