My goal is to narrow several hundred Variables to those with the highest impact on market value of a series of several hundred homes (some have various qualities while some do not–these are the variables). I used a simple binary scoring for each home and each variable. (1=has variable; 0=does not have variable.)
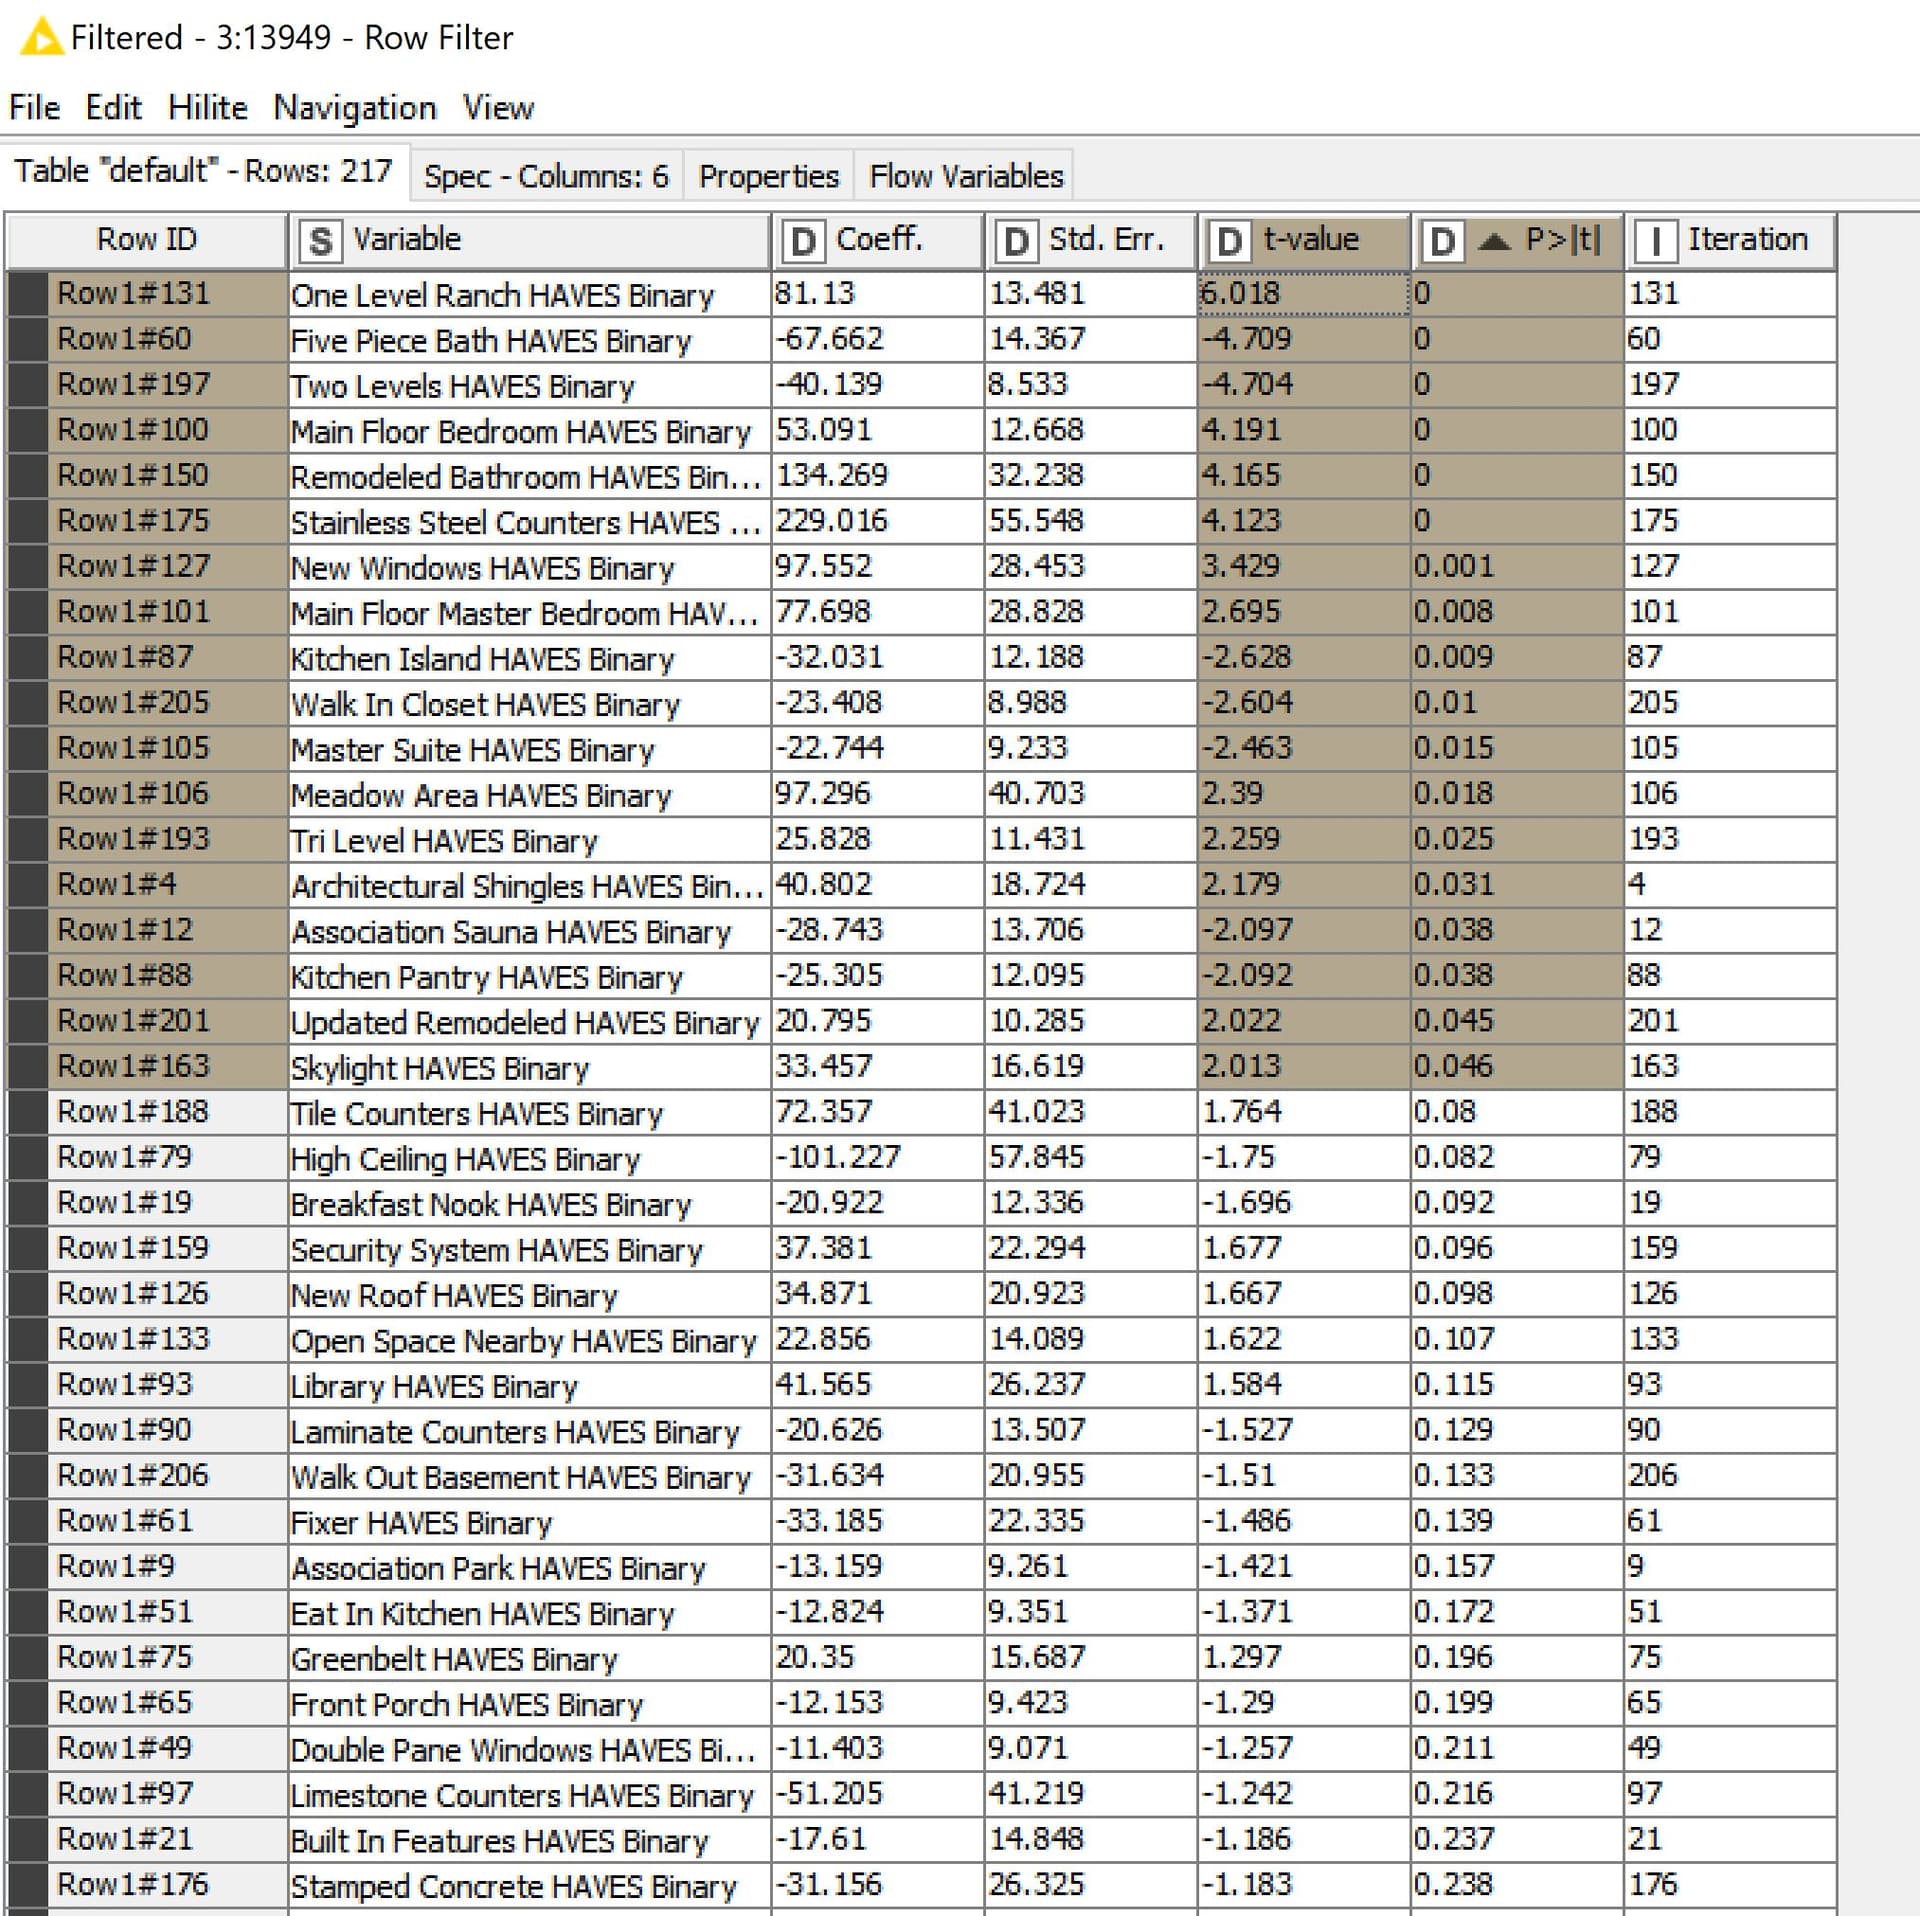
For the initial step my theory is if the P-Value of a variable is <= 0.05 it should be included in the initial list of variables and at least has a probability of making an impact on the series of homes within the group.
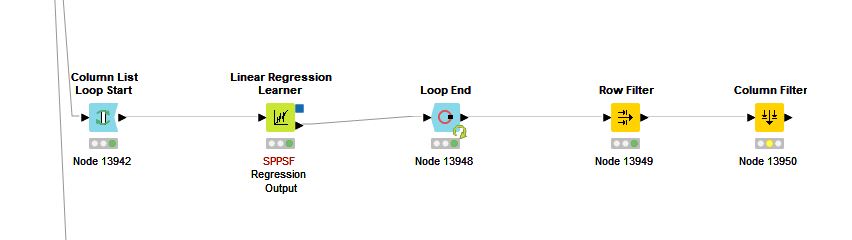
I set up a Linear Regression Loop to score the P-Value of each variable.
From a data science perspective is my logic sound and should I be considering other strategies to discover the highest value impacting qualities for each set of homes?
I know this is outside of the typical KNIME question but appreciate your thoughts. Thanks
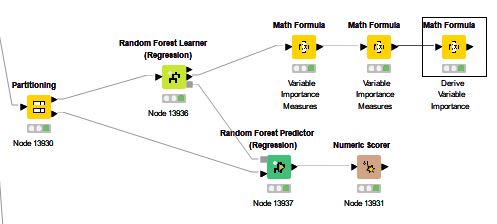
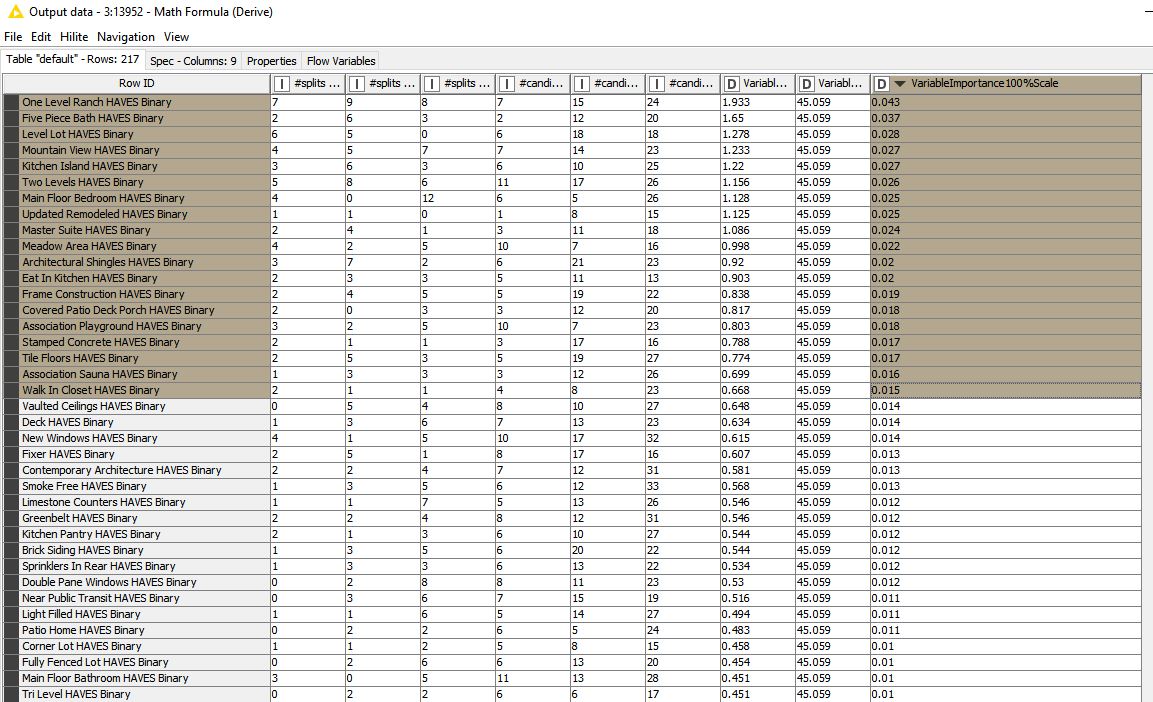
PS: I did also run a random forest regression and used the KNIME suggestions on deriving the variable importance. I am now looking into how the Linear and Random Forest outcomes align–or don’t, and am open to any/all further suggestions. Thanks
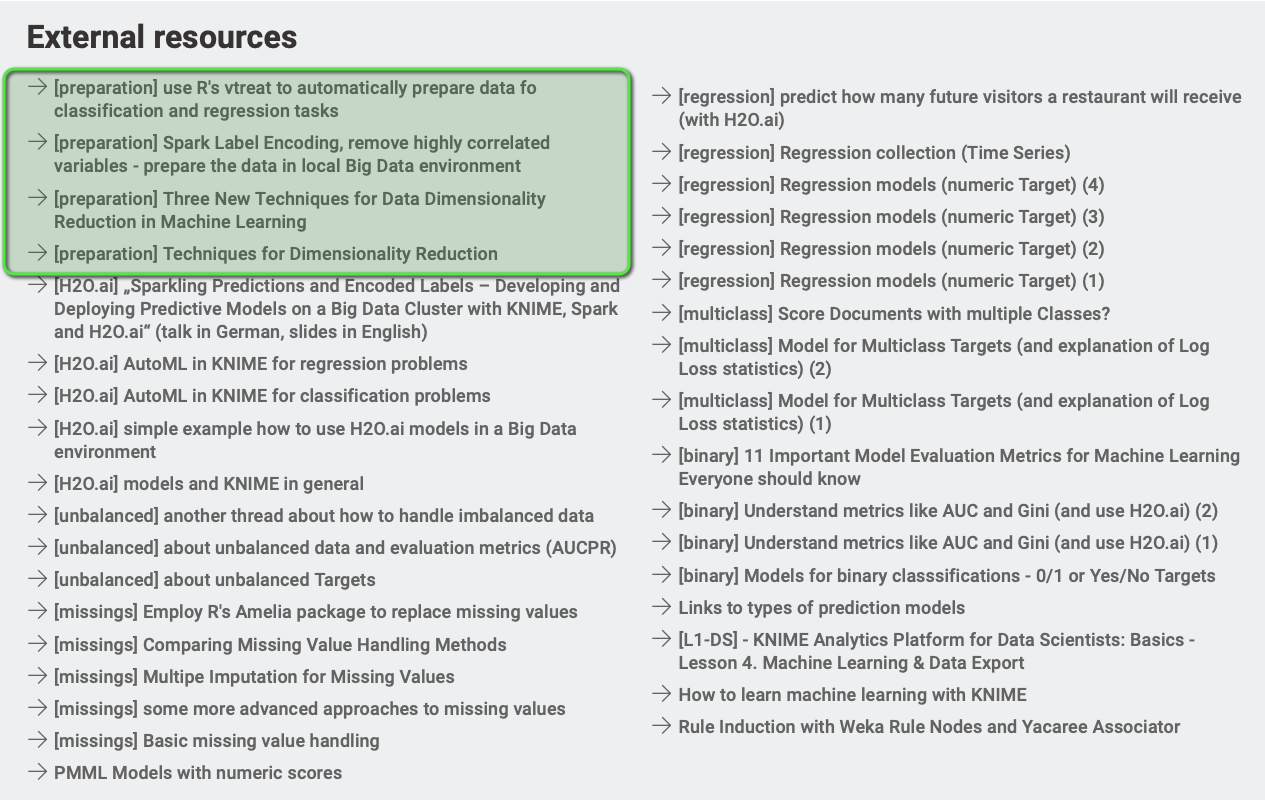
@mlauber71 , thank you. I will check out all. I used the low variance and correlation nodes when reducing the variables from approximately 230 down to 40 or so under different methods. The P-Value in Linear Regression was something new I was trying because I did not like the value contribution results I was seeing. It’s tricky stuff as what I am really doing is isolating the contribution values of four categories within the sale data, one of which you see here in the 230 or so variables.
I will check out all of your suggested links. thanks