Hi,
I’m working on the Data Visualization Exercise Task 3 and I have a problem. I don’t have a “Input data and view selection”. Can anyone help me with it please?
Thanks a lot!
Hi,
I’m working on the Data Visualization Exercise Task 3 and I have a problem. I don’t have a “Input data and view selection”. Can anyone help me with it please?
Thanks a lot!
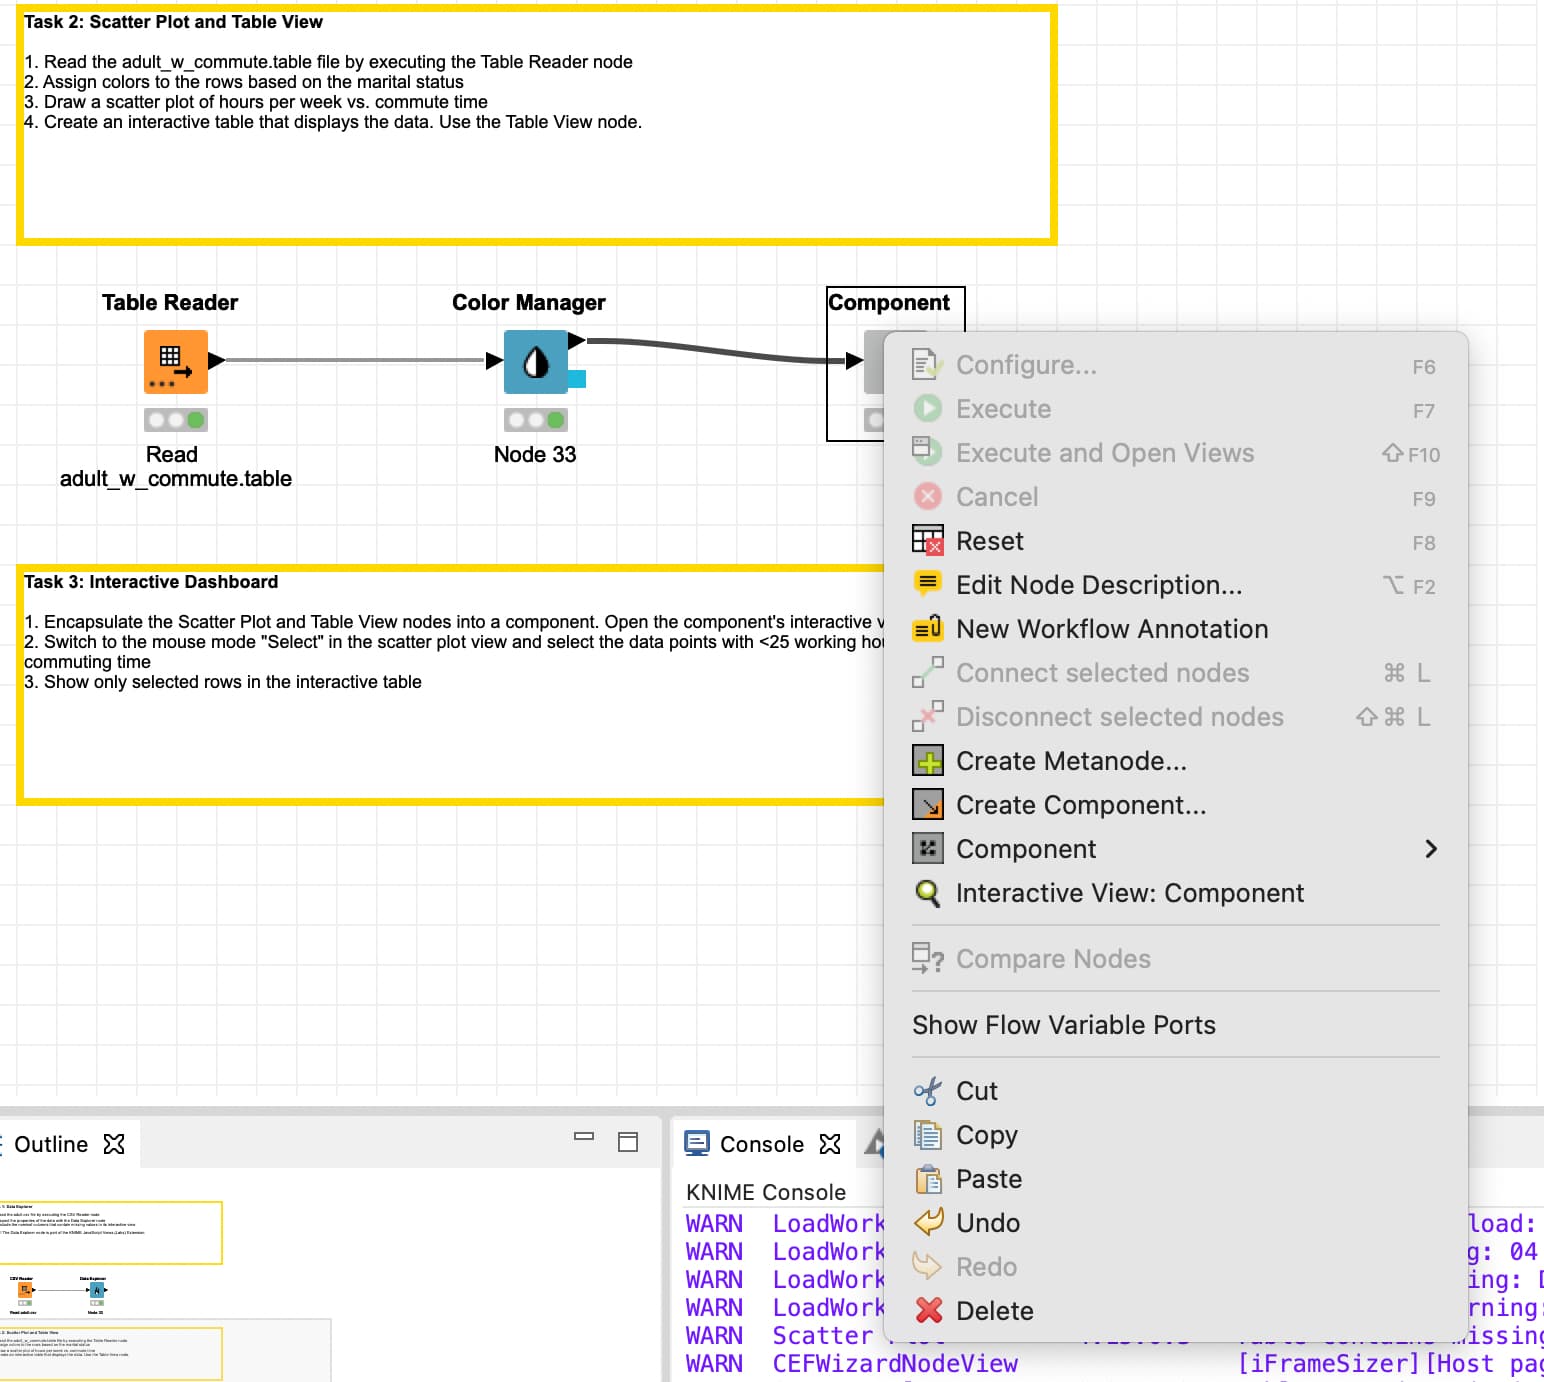
Hi @ppeng and welcome to the forum. I moved your question because you posted on a topic associated with a different workflow. I think this is the workflow you are dealing with, yes?
Having said that, I still don’t understand your question or problem. Can you restate what you’re trying to do?
thanks for the quick reply! @ScottF
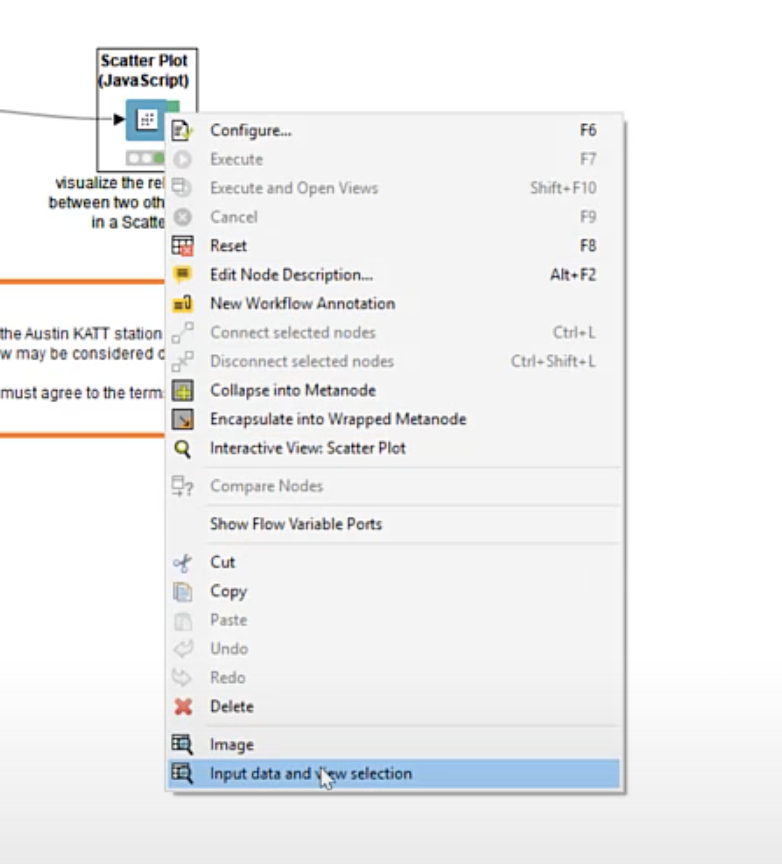
at the scatter plot video (after using the mouse mode “Select”, she clicked the “Input data and view selection” to show the result.
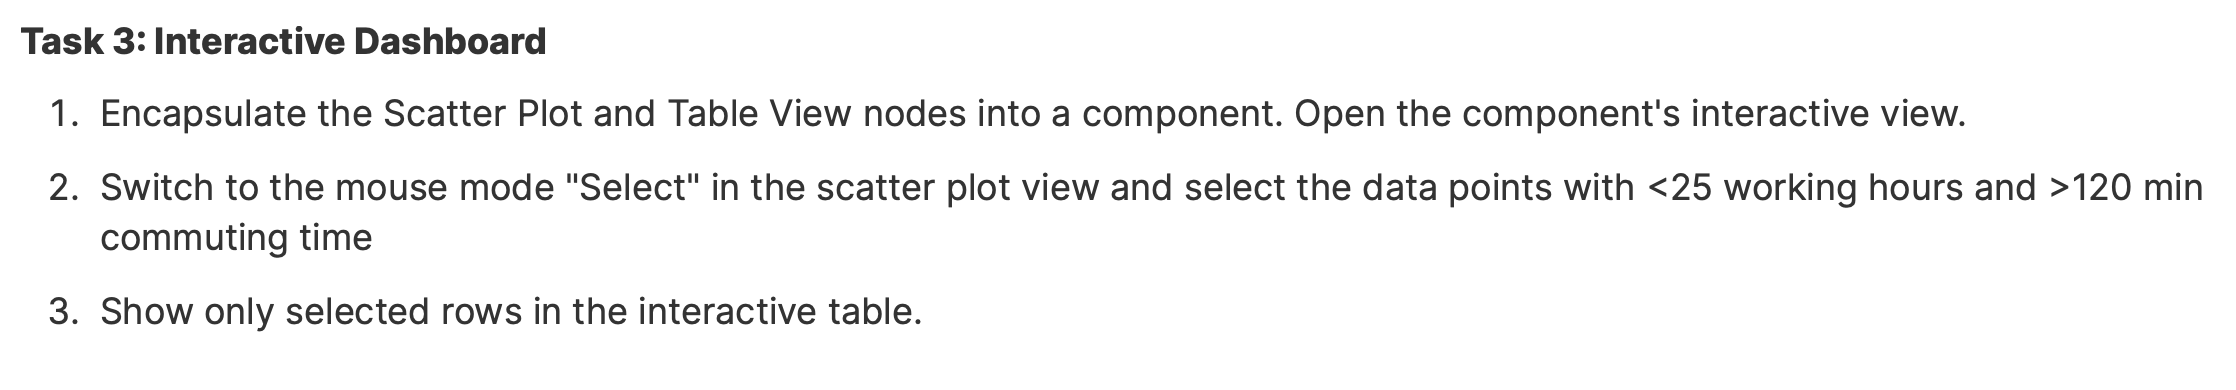
which I tried to do the same thing, due the the Task 3 I should select the data points with <25 working hours
and yet, after doing the following points I can’t view the table
After making your selections in the interactive view, did you click Apply at the bottom right corner of the dialog so the node would remember them?
yes I did. Apply → Close. We
(I reset the Component twice and started again, didn’t work either)
Can you upload the current version of your workflow? You can got to File → Export KNIME Workflow, then attach the created .knwf file to this post.
I think what’s happening is now that your Scatter Plot node is inside the component, you’re not sure where to look for the output port.
You can go inside the component by right-clicking on it, and selecting Component → Open, where you should then be able to see the selected records in the output port. You can also configure the component itself to add output ports by right-clicking on it and selecting Component → Setup, then adding a data port, then going inside the component to make the needed connection.
For more on component setup, check out our docs below:
https://docs.knime.com/latest/analytics_platform_components_guide/index.html#_setup_components
Hello @ScottF
I have another problem due to the visualization Task.
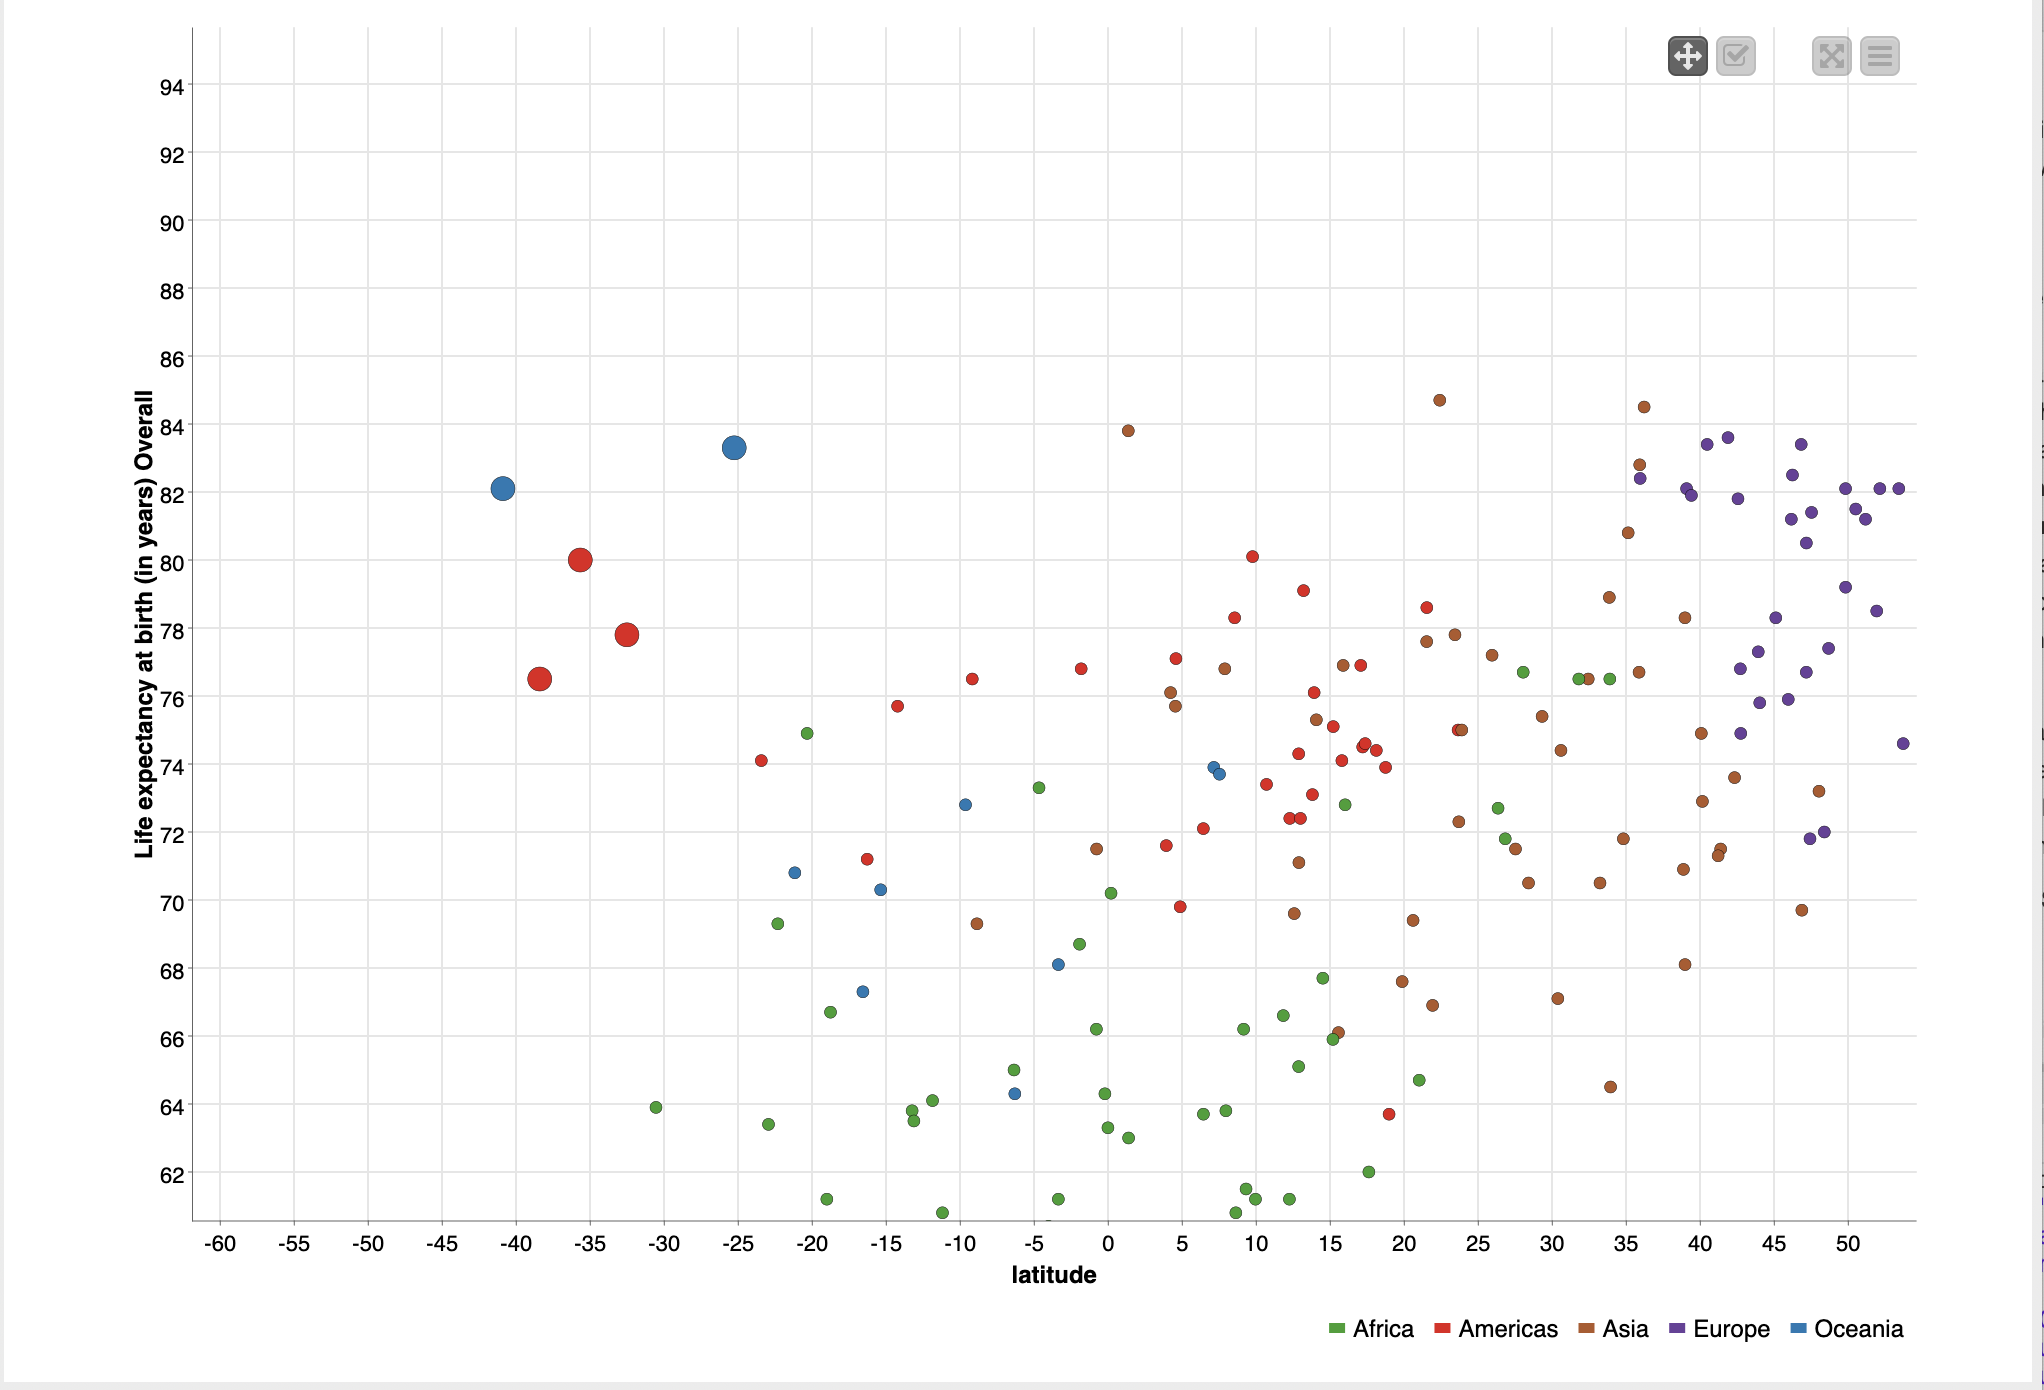
I selected the points on the top left corner (as you can see through the photo. After Apply → Close, I wanted to see which 5 countries it is, so I selected “Input data and view selection”. Unfortunately I couldn’t see those five dots I selected. Can you help me out? Thank you!
04 Visualization - Solution.knar.knwf (26.7 KB)
Hi @ppeng -
The various Javascript view nodes append a boolean column to the end of the table named “Selected”. You may have to scroll over to the far right of the table to see it. Rows corresponding to the points that you highlighted in the plot will be marked true, and others will be marked false.
This topic was automatically closed 90 days after the last reply. New replies are no longer allowed.