Hello everybody,
is there a way to display the centroid point of each cluster in a Scatter plot ?
Thanks in advance,
Enigma
Hello everybody,
is there a way to display the centroid point of each cluster in a Scatter plot ?
Thanks in advance,
Enigma
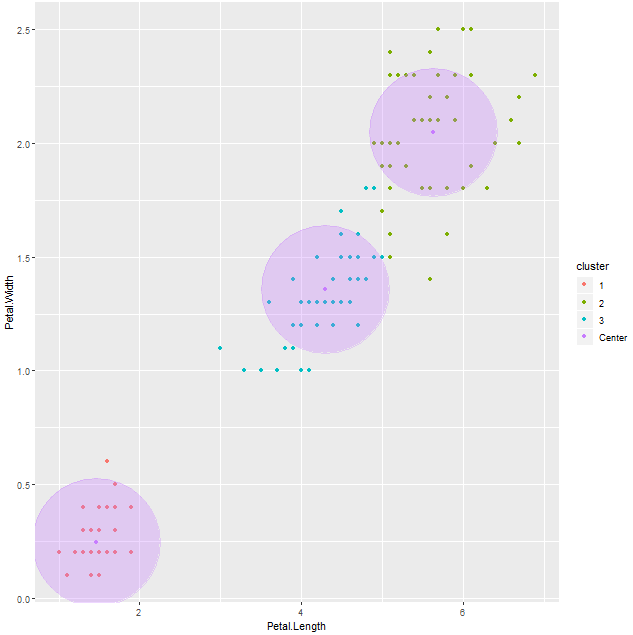
Hi E, please find attached an example of a cluster centroid done in R. I do not know if the native Knimes nodes can display the centroids.
You need to setup R in Knime and have the ggplot2 package installed.
99% of the code belongs to r-bloggers.com “Bot Botany – K-Means and ggplot2”
Best regards
MauKmeans Centroid.knwf (6.5 KB)
The second output port of K-Means node presents the centroids points of each cluster. You might want to modify them (using different color / shape) and then add them to your original dataset to plot all data points together with the clusters centroids.