Hi guys, it’s been a while, hope you’re doing great!
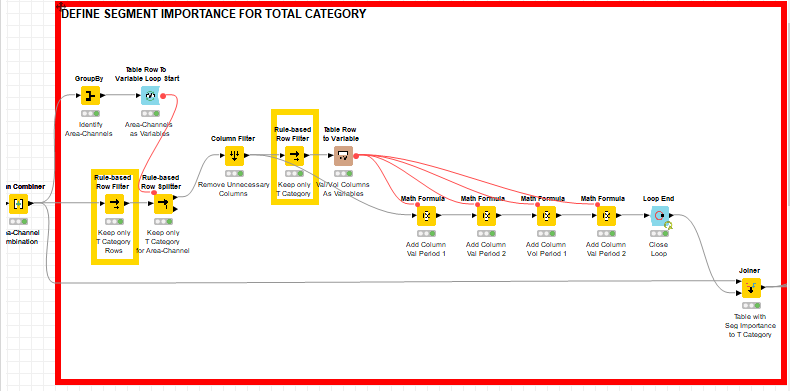
I have a (I believe) complicated question. I have a list of sales of a given Product Category, which has the sales for the Total Category (contains sales of all Brand-Segments), the Total Segments (sales of all brands selling products of that specific segment), and Brand sales (both at Total Category and by Segment). I have values for different types of stores, including Total Stores, and for different regions, including Total Regions.
To illustrate, imagine that I’m talking about Alcoholic Beverages, and I have T Alcoholic Beverages (which is Total Beer + Total Whiskey), Total Beer (Brand A Beer sales + Brand B Beer sales), Total Whiskey (same as previous), and then Total Brand A (Brand A Beer + Whiskey), Brand A Beer, Brand A Whiskey and the same thing for Brand B. I have this data for Total All Stores (Big + Small) and also split into Big Stores and Small Stores. Finally, same data is available for Total All Regions and then split by country.
First problem: I want to create multiple columns which have different types of calculations, but that are basically calculations of importance. For instance, I might want to know the importance of Beer sales that a Region-Story Type has when compared to our Total Region, Total Stores, Total Beer. I want to apply this importance to all product rows within that Region-Store Type that are Beer (so T Beer, Brand A Beer, Brand B Beer), and so it goes. I’m attaching and Excel file with mock-up examples.
Second problem: I’ll be replicating this for different Product Categories. Although my data will still be split by regions, store types, and will have product lines with Total, Segment and Brand data, the names will obviously change (I’ll have different regions, store types, Brands, etc). ideally, I’d like to build something run when using different Product Categories.
I know it is quite complicated, but anyone could help on how I can proceed to do this?
Kindest of regards,
GuilExample.xlsx (14.8 KB)

