hey guys,
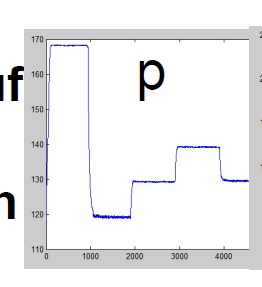
a simple question mayebe… how can I get a time based diagram like pic below…? the columns are time, and pressure, horisontals in the diagram must be time [s] vertical pressure…
hey guys,
a simple question mayebe… how can I get a time based diagram like pic below…? the columns are time, and pressure, horisontals in the diagram must be time [s] vertical pressure…
Hi @joan -
This sounds like a job for the Line Plot or Line Plot (Plotly) nodes.
If you need sample workflows for generating such a plot, there are several on the Hub. 
This topic was automatically closed 182 days after the last reply. New replies are no longer allowed.