Feature suggestion: axis limits for plots

Dear Knimers,

sometimes I want to be able to manually set the axis limits of a plot. For example, when visually comparing different plots it is nice if they have the same axis limits. Or, sometimes it is nice to have the origin (0,0) in lower left corner. Unfortunately, the Knime plotting nodes do not seem to have a configuration option for manually setting the axis limits. Of course, I can manually scale the plots after plotting, but that is not very exact. The workaround that I found is add invisible (white) data points to opposite corners of the plot, but that only works for the Scatter Plot and if there are no real data points that fall outside these limits.

My suggestion is to have a configuration option for setting the minimum and maximum of the x and y axes of a plot; something like set_xlim and set_ylim in Python’s Matplotlib.

Or is there already a way to do this already that I missed somehow?

Best
Aswin

Missing word in title is missing… (“plots”)

Yes this is a real value add. Please put this on the list asap.

Ben

Hi @Aswin

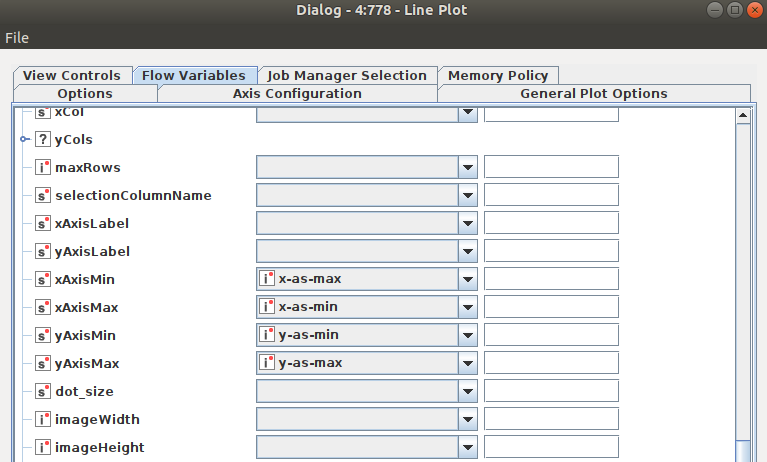
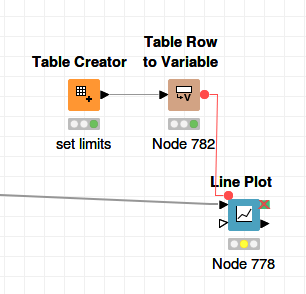
You can control the axis limits setting for a LinePlot by using flow variables.


Schermafdruk van 2021-05-23 10-51-30
gr. Hans

2 Likes

Thank you @HansS!!! I see the Scatter Plot has these flow variable settings as well. How did I miss those before…?

2 Likes

This topic was automatically closed 7 days after the last reply. New replies are no longer allowed.