Okay… I have a table with donations per donor (rows) per year (column). This is what my table could look like:
2010
2011
2012
2013
Row1
?
5
10
5
Row2
?
20
?
20
Row3
10
?
?
?
Row4
5
5
5
5
Row5
?
?
50
10
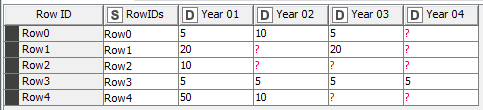
I want to transform this to a table that tells me how much someone donated in their first, second, etc. year. This is what I want it to look like:
Year 1
Year 2
Year 3
Year 4
Row1
5
10
5
?
Row2
20
?
20
?
Row3
10
?
?
?
Row4
5
5
5
5
Row5
50
10
?
?
I don’t want to remove all missing values, but only those before the first year of donating.
The table contains almost 200k rows, so a group loop (per donor) is not ideal. Right now I do have a group loop, then transposing the table and calculating a cumulative sum (so missing values in between are dealt with), then removing all empty rows, transposing again.
But there must be a simpler solution, right? Just can’t figure it out…
I made a small modification, the sorter has been eliminated before the Rank node in order to the better performance on large dataset. I implemented a sorter after the last pivoting node in order to the better view (ascending by) RowIDs.
Yesterday evening I came up with a similar solution (unpivoting, determining the first year in a group by, then calculating year x (year - starting year + 1) and pivoting on that column).
I also like your approach @gonhaddock for adding the zero to the left. I’ve done this many times to make sure a sorter works perfect. However, I always did it like this:
The double reverse was a bit of a mindf*ck every time, but was a good workaround for RIGHT(). I’m kinda missing RIGHT() and LEFT() in the string manipulation… Hope this will be added in the future!