As a test, I currently am using an Excel datafile with 10 rows and 5 columns. I have generated a template report in Knime. On the report I used the “Table” item to add the specific column of data in the designated area of the report template. I would like to use each row of data to generate a single page which in turn becomes a multiple page PDF based on how many rows are in the datafile. The issue I am having is that it is printing data from all 10 rows on one PDF page, I need it to be 10 separate pages. I am trying to create invoices to different customers, essentially trying to mimic mail merge in Word.
Okay that sort of helped, my new issue is two fold;
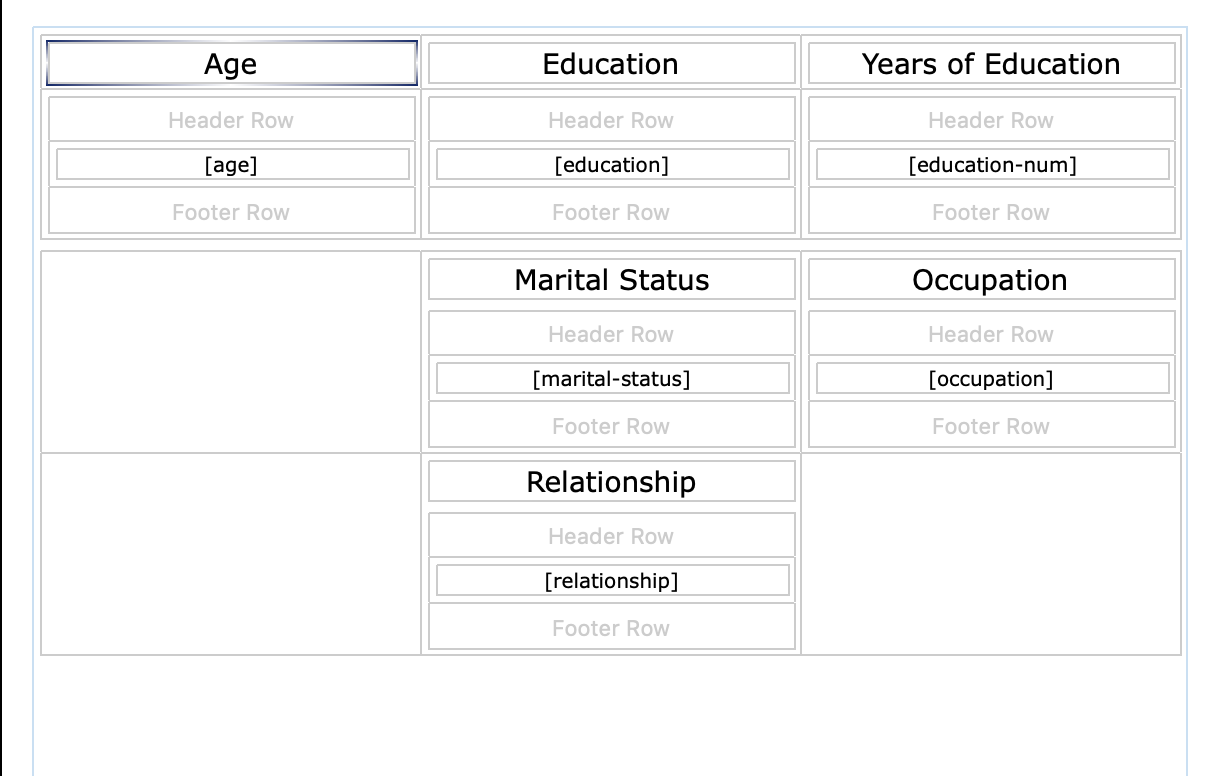
The labels I have inserted above each table item are not printing on any other page except the first page.
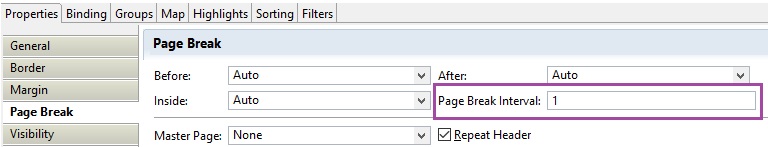
Secondly, I have three different areas where data is on the page of my report so when I use the page break = 1, it prints out all the top three table columns data first for 10 pages then it start with the next report page items for the remainder of pages.
what I want to achieve is all different table column items on one page and then move to the next page at the start of a new row of data
Have you added data fields from different data tables?
If no, why have you used multiple table items?
You can use one table and move data items to different cells to arrange your table, you don’t need to use grid to do that.
If your data comes from one data table, then use a single table item to represent it.