Hi
I’ve been looking at integrating more plotly charts and getting the SVG export function working.
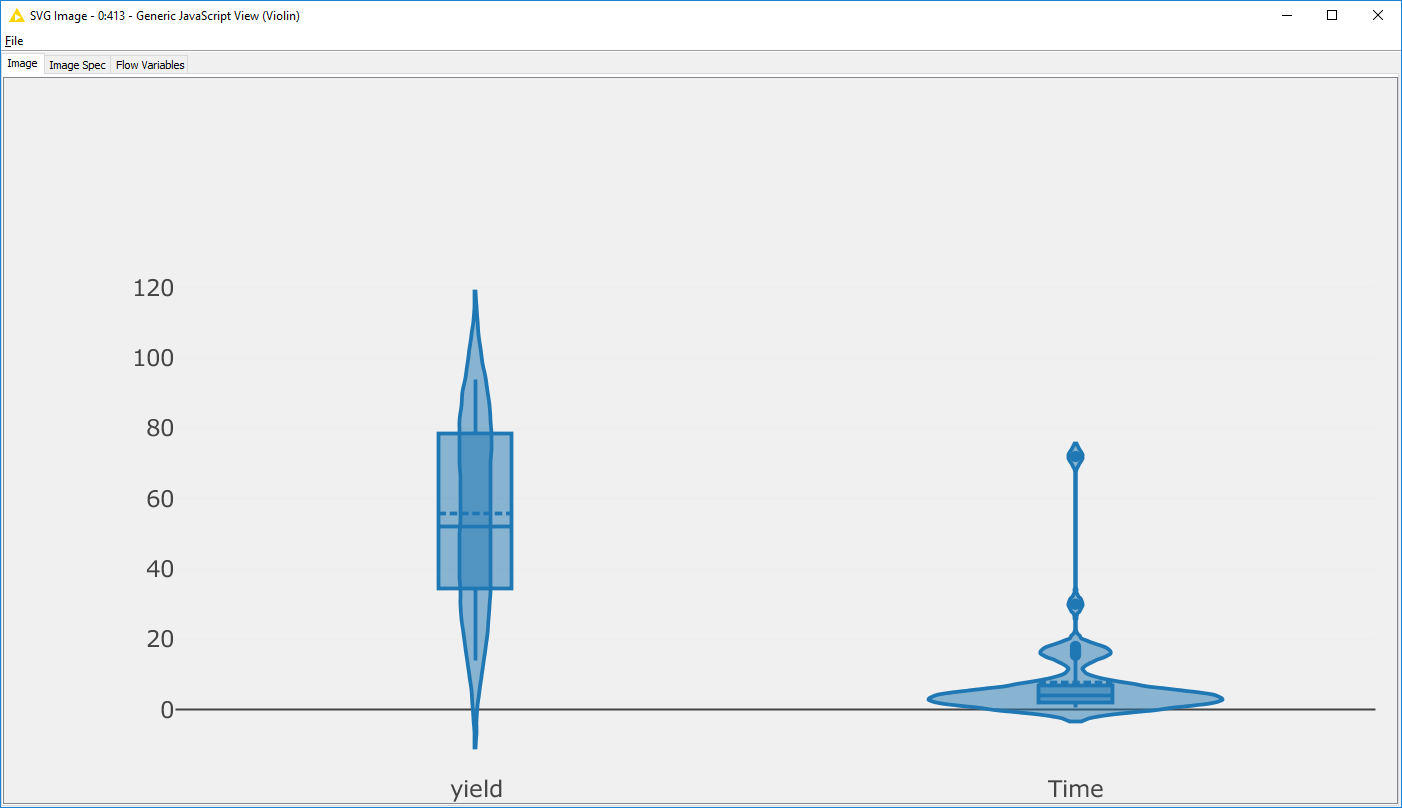
For the histogram I’ve got this working but I get an error (or rather lack of output) when testing this on a violin plot.
The SVG code works when testing it and printing to console in the JavaScript view but it doesn’t seem to execute or gets an error in the Image Generation tab. I have tried setting the wait time up to 10 seconds.
The code can be found here: https://gist.github.com/webbres/20160b453d99f878a13fd5b8edbca1df
The code for the SVG export is here: https://gist.github.com/webbres/d8fdee6ee6f28779e407088d60158fc2
I’ve not found out if I can debug or see console output for the SVG generation?
Any advice on debugging the SVG generation is appreciated.
Cheers
Sam