Now i actualy just want to group the values of the humidity depending on the count value to get a average value of the humidity. The last step using the Node GroupBy does work with the shown data, but it does not seperate in the different timesteps with same humidity values. So my idea was just to implement a count value … Maybe there is a better way or somebody could help me to generate the count values?
Now i actualy just want to group the values of the humidity depending on the count value to get a average value of the humidity
I can’t figure out the logic behind your desired output data. You have humidity values of “20” that are in separate groups. How does that work?
It seems to me that if you want the average humidity setpoint, you just need to specify need a time period over which to average, and for this you can use a Window Loop Start node. I’m probably missing something, but I’m not sure I see how a count value is going to be useful.
Hey,
the rawdata is actualy a filtered dataset. The data was generated by a climatic chamber where the temperature and the humidity will be changed in few seconds or only few minutes. Every change represents a new measurement. So our disire is to get the true average values based on the setpoints.
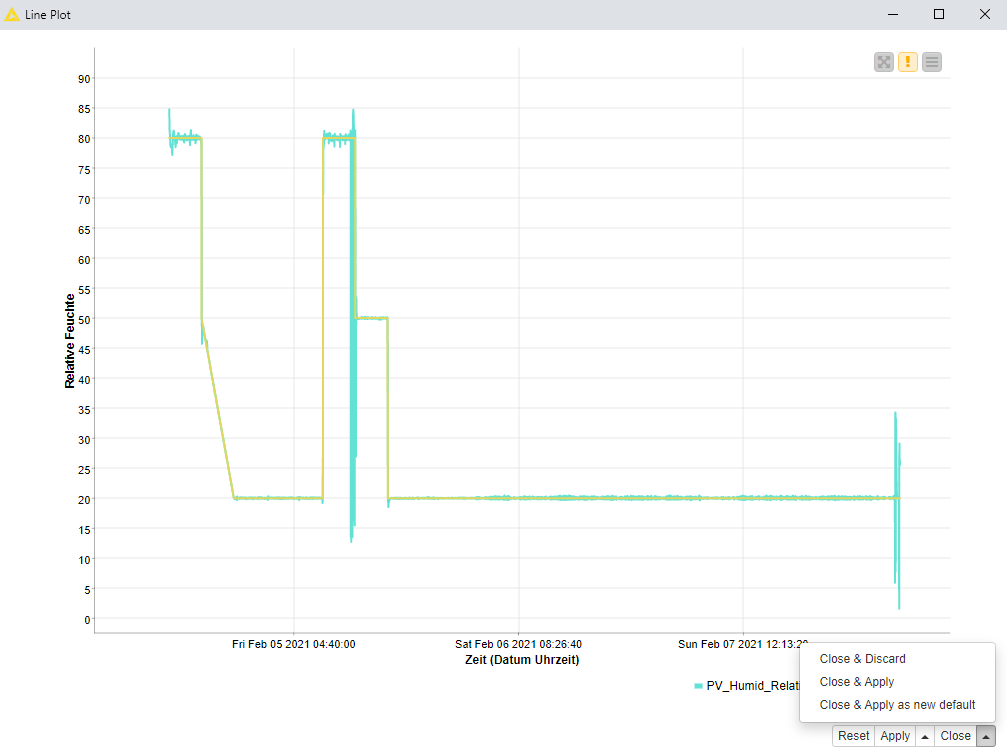
I can not use timesteps because the reason i want to use knime is to fully automate the analysis without determine timesteps. So a realy simple dataplot of the humidity and the setpoint of the humidity would looks like this (setpoints in yellow and measured value in blue):
I filtered the ramps out (with knime) so i have a clear dataset of the region of interest (only the horizontal regions). Thats why there is a split in two different values and why i wanted to implementate a count value representing each measurement.
I am pretty new in knime. I am usually working with OriginPro but Knime looked pretty good for my problem.
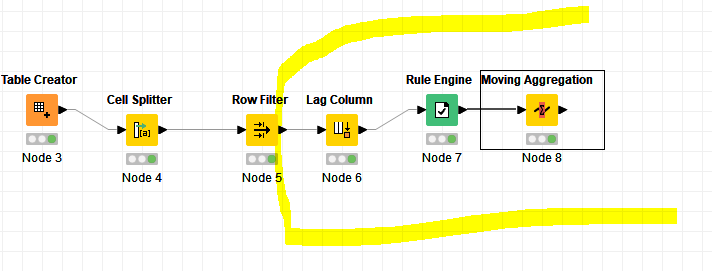
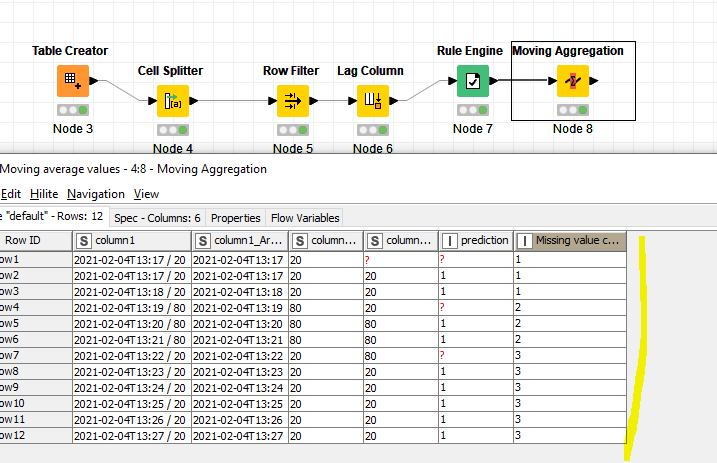
You can do that with a lag column, a rule engine and a moving aggregation
Lag column you can use 1, 1 for your humidity column
for rule engine you check whether the humidity column = lag column (if so return 1)
if you do that then each change shows a “?” which means “missing”
Finally you do a missing value count for cumulative aggregation in the moving aggregation node