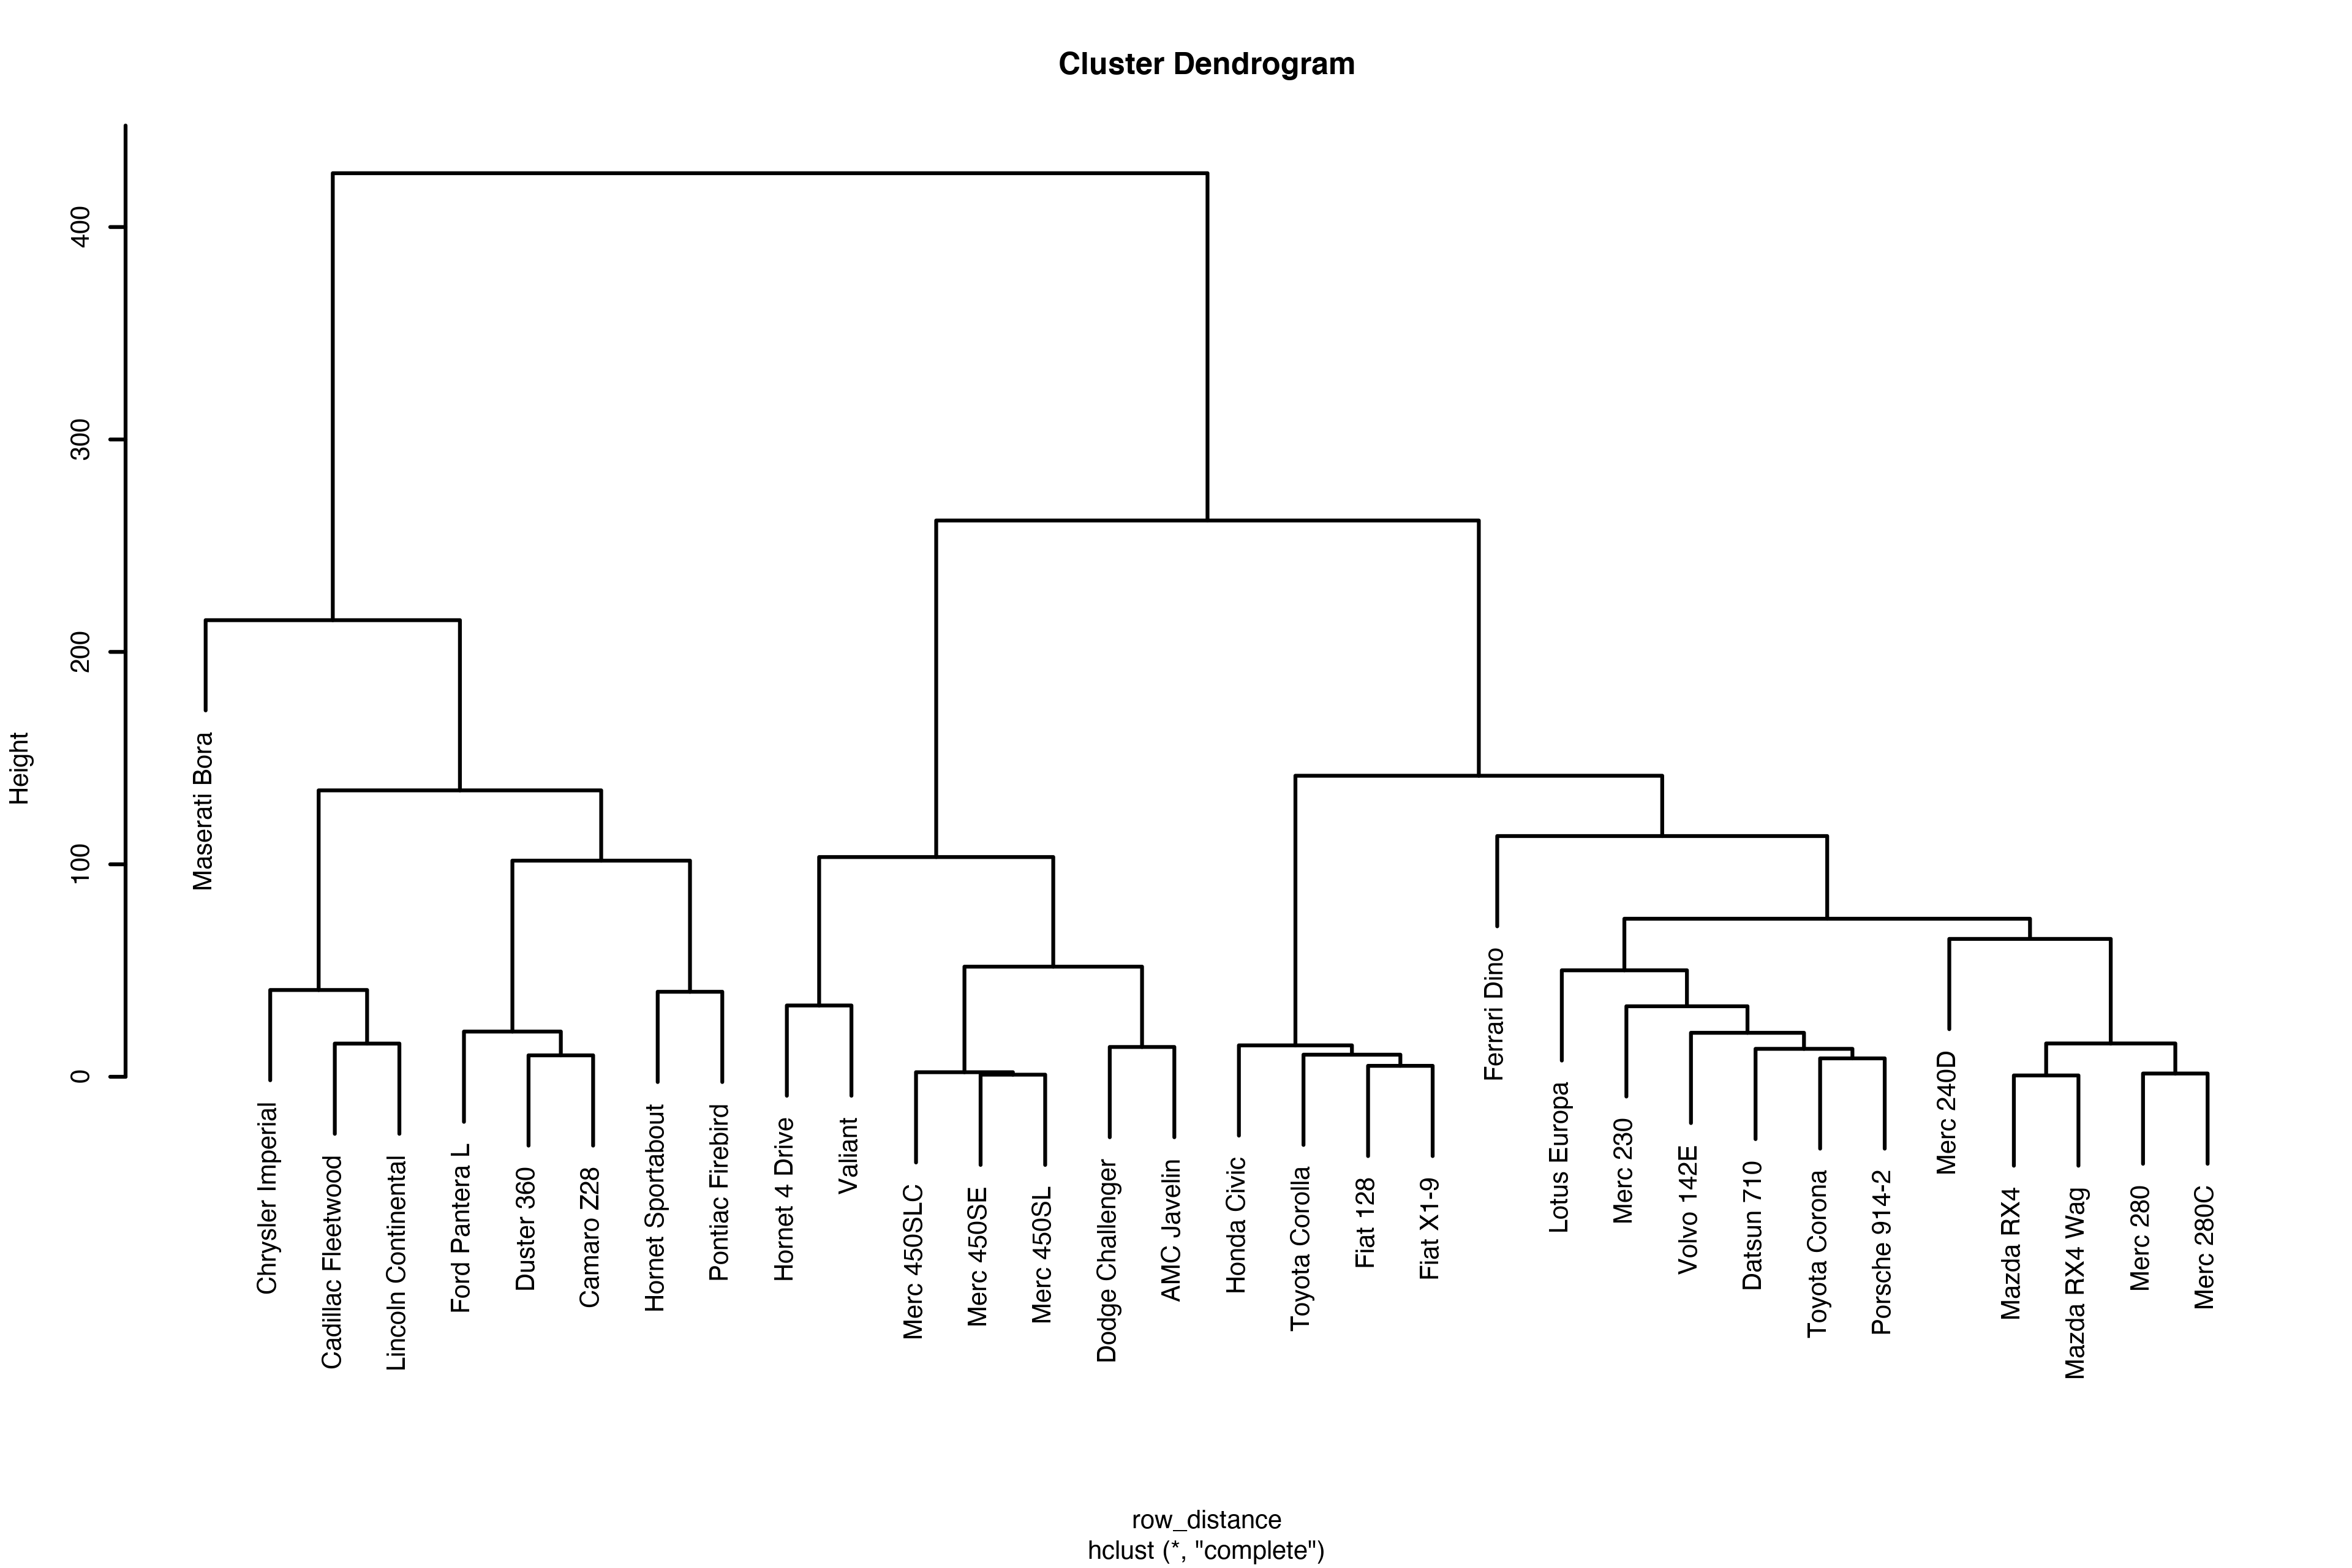
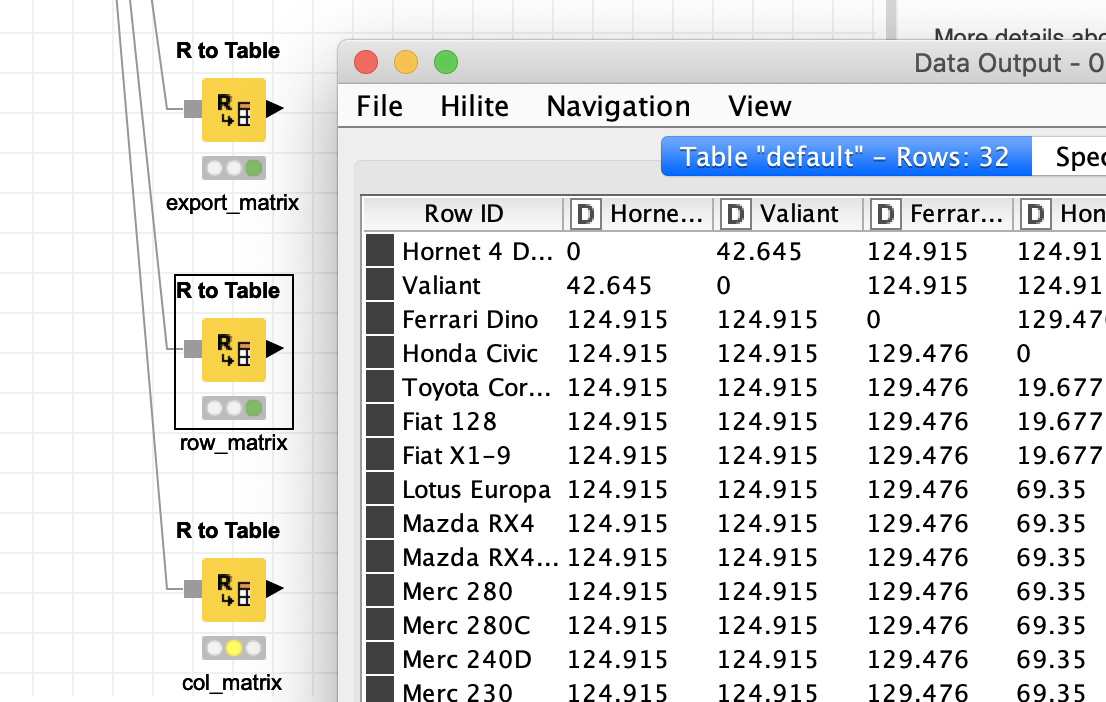
That is possible with the help to R. You would have to check the code if the distance and cluster settings fit your needs. You can also export the numbers behind the clustering of the ‘teeth’.
The data is from the ‘cars’ dataset like in your example. I did not check if the heatmap makes sense. The interpretation would have to be done in addition to some column selection and it might be necessary to normalize some data in order for it to make sense in such a display.
edit: there might be a more KNIME-like way although I have not checked it out: Dendrogram with Heatmap (Clustering) - #4 by aborg
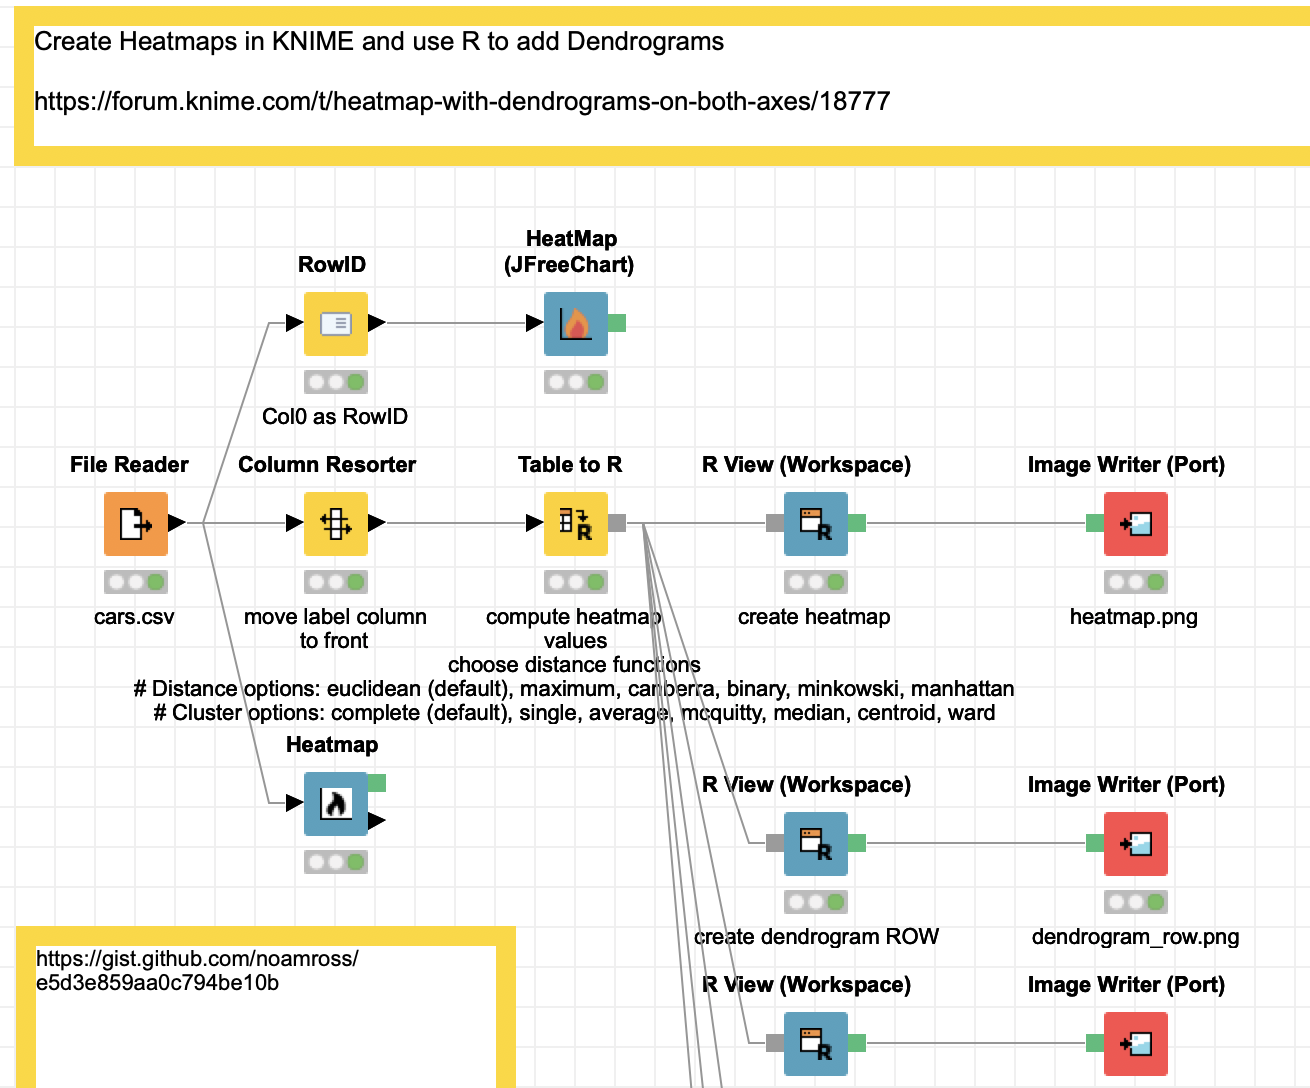

kn_example_r_heatmap_cars.knwf (346.2 KB)
Edit - A new version for KNIME 5: R Graphics - Create Heatmaps in KNIME and use R to add Dendrograms – KNIME Community Hub