Brenda
March 14, 2021, 8:18pm
1
Hello Community,
I would like to ask you about a problem I am currently experiencing. I have a
@Brenda
Welcome to the world of KNIME.https://www.knime.com/nodeguide/visualization/geolocation
For sure there is much more information available.
For creating a report I’m not aware of a solution.
For the creation of interactive maps solutions like umap uMap might be a potential solution. Here you can simply visualise the geo information.
3 Likes
Brenda
March 25, 2021, 4:49pm
3
Hello,
Thank you for your answer. The nodes you gave me help me better understand.
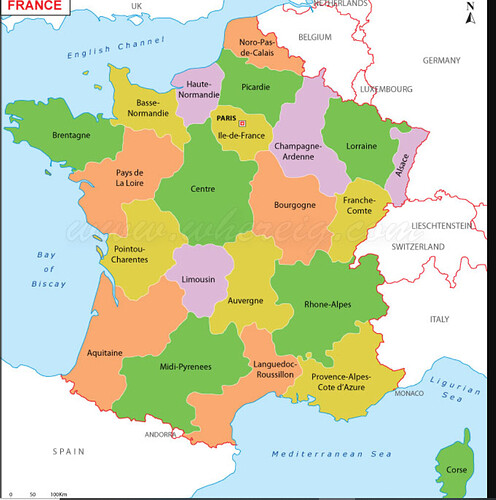
Now my question is how can i use Knime to recreate, transcribe the France map like in the photo?
thanks.
@Brenda
Sorry for the late reply.Open Street Map - World Cities – KNIME Hub
Maybe that helps you to further develop your own workflow.
2 Likes
system
October 8, 2021, 7:23am
5
This topic was automatically closed 182 days after the last reply. New replies are no longer allowed.
