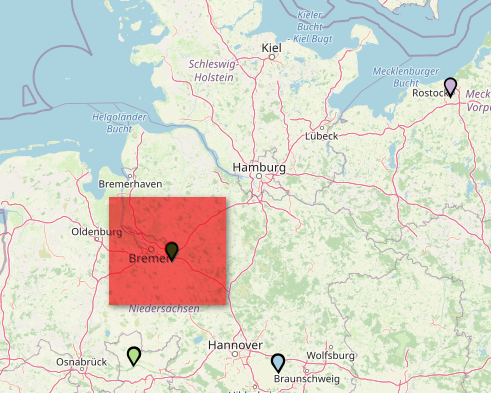
I plotted my data on a map. This are customers.
In the red marked teardrop are 2 datas.
The customers have to same lat/long and coordinates, so they are overplotted.
How can I eliminate the overplotting?
I want to show, that there are 2 customers in the same city.
You could remove duplicates (same long/lat) or you could add a jittering effect by labeling your duplicates and then modifying the lat/long slightly. This depends on your data and what nodes you are using.
The Duplicate Row Filter node will help with either task.
The Map Viewer also supports attached size information. So you can make markers bigger if there’s more than one location on a point or area. Have a look at this node for creating the size meta data:
The 2 data points are not to see. Just 1 teardrop…
My idea was to visualize the count via the size. The more customers in a given location/area, the larger the dot. You could do this with the Size Manager and some additional preprocessing.