thanks for mentioning this.
no it is not deliberate.
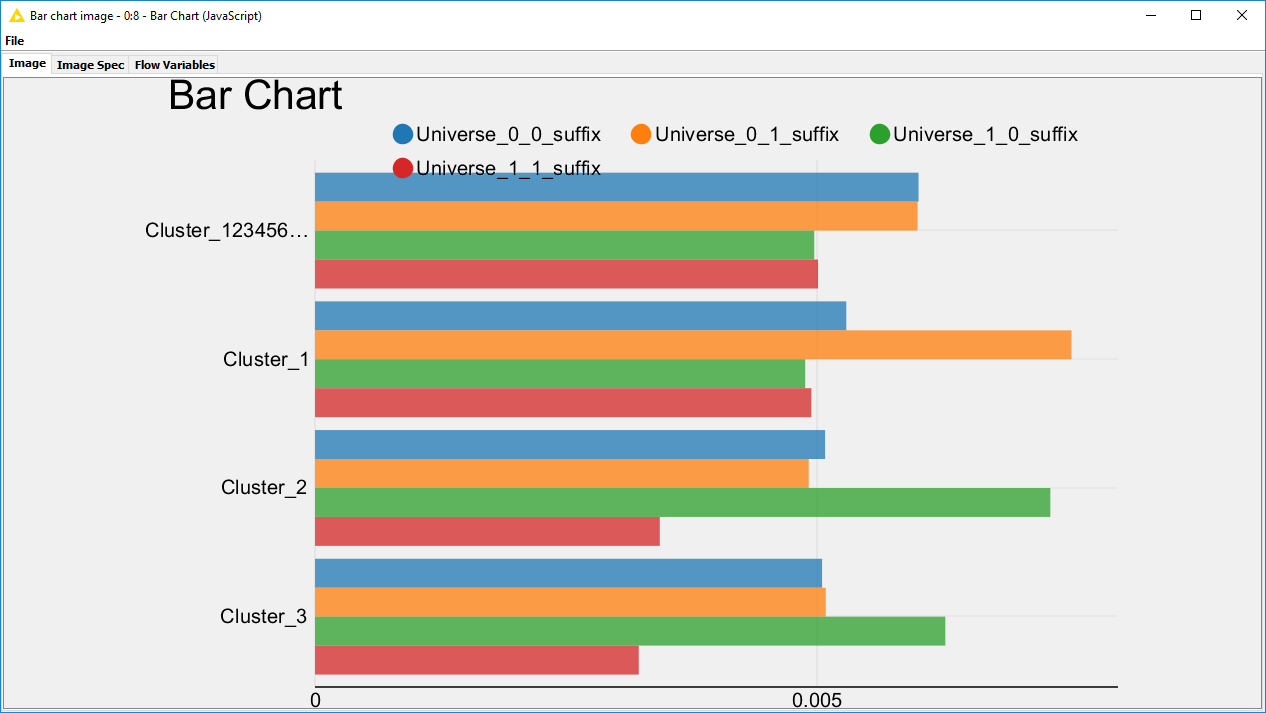
we applied some fixes to take care of responsiveness of the bar chart labels, ticks and mouseover tooltips.
the fix required us to set a maximum width to labels depending on the size of image,
so that you never have a chart that is squeezed out by the space used by the labels.
We are currently working on truncating them only when there is no other choice…
so they can stay long in most cases…
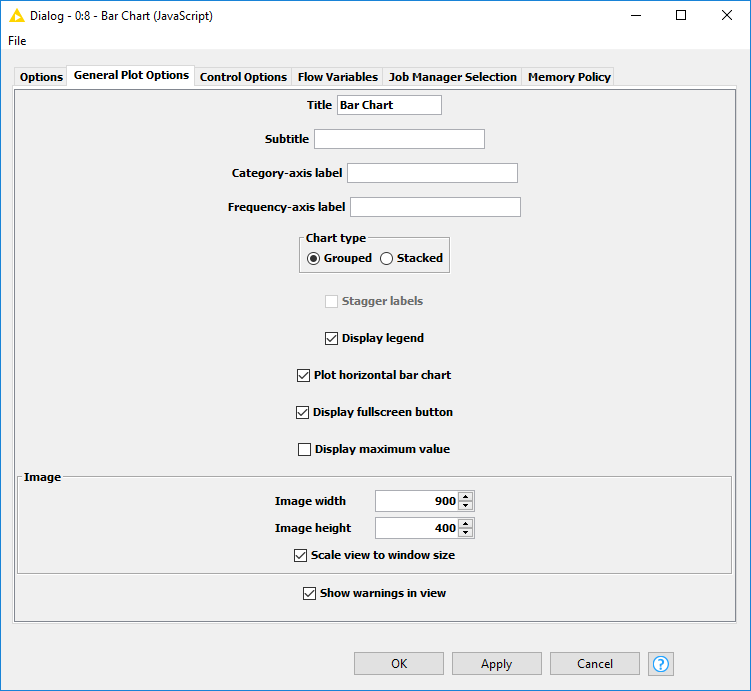
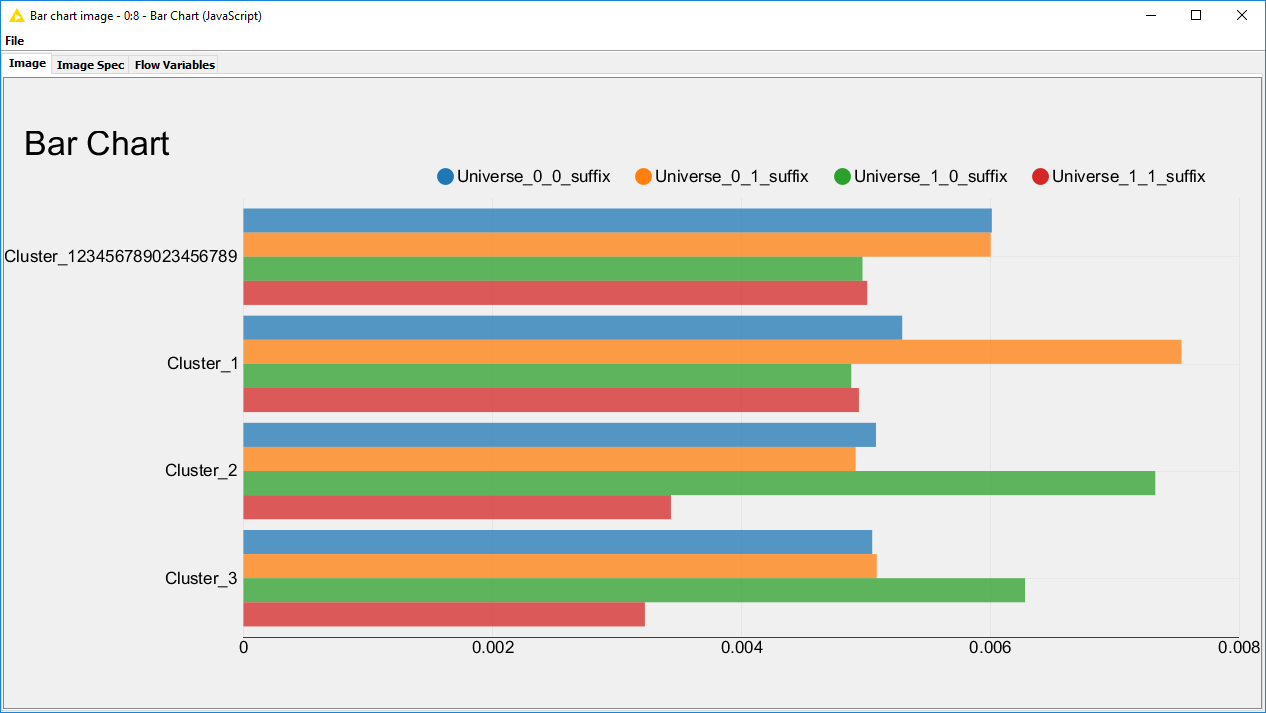
In the meanwhile you can fix your problem by changing the sizing of your browser window/svg output image.
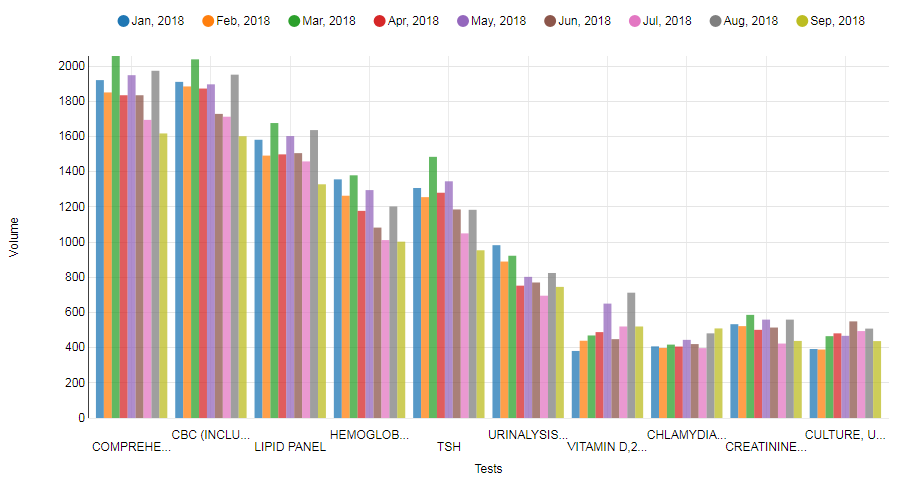
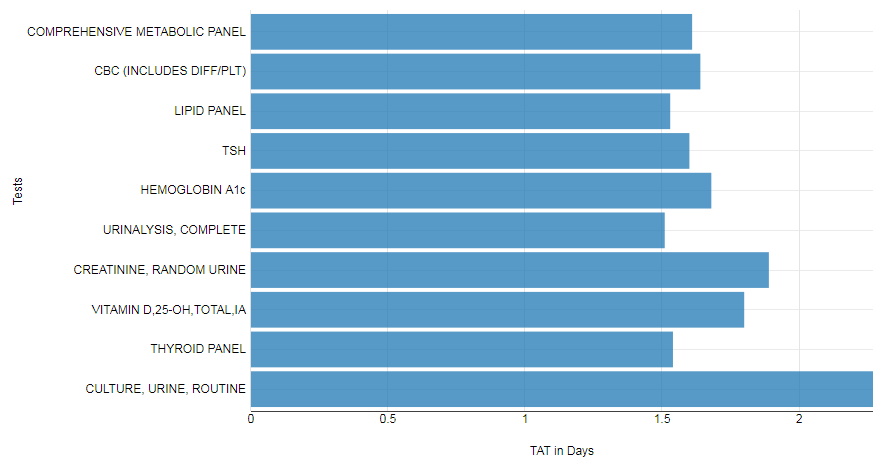
For example if you leave the bar chart default options for the output svg file sizes (600x400) this is the output:
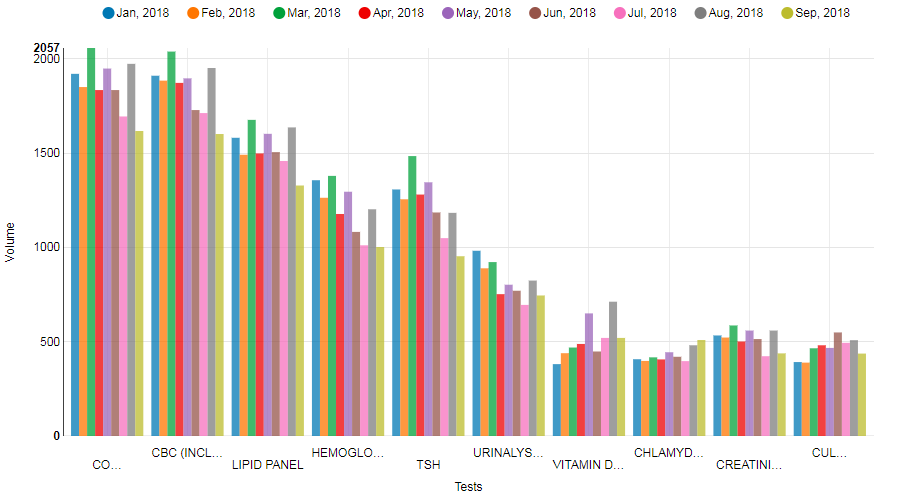
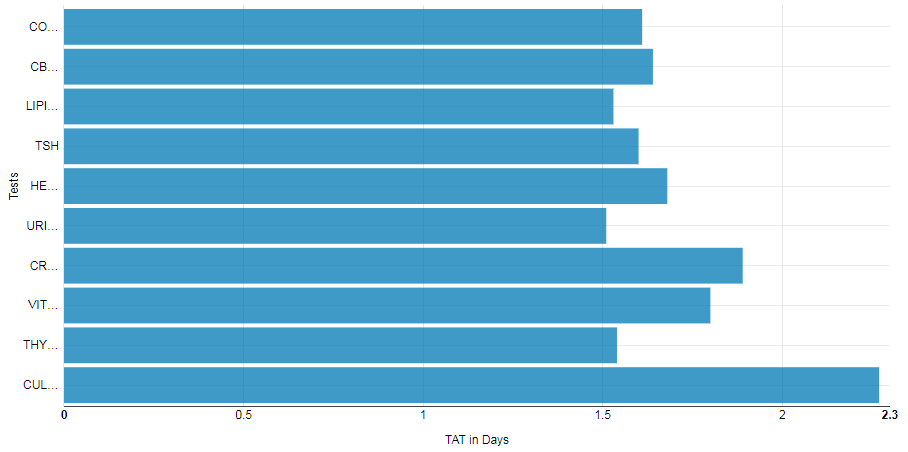
same goes when resizing the layout of a composite view…
in that case you should be making sure that the browser window is full screen
and that the bar chart takes a full row in the layout…
I hope this was useful
let me know if you need more guidance
cheers
Paolo
For now I have downgraded to 3.6.1 as changing the resolution of the image did not work for me. I can change the image resolution only so much as I use it in the webportal.
Glad to know that you are working on the fix. Look forward to it in 3.7