Just to see how this might go I have adapted the approach to include a split day where before and after the system would try and calculate the trends:

In your case the split date would be 2020-04-01 and there would be two distinct trend lines with different coefficients. I hope I got them right:
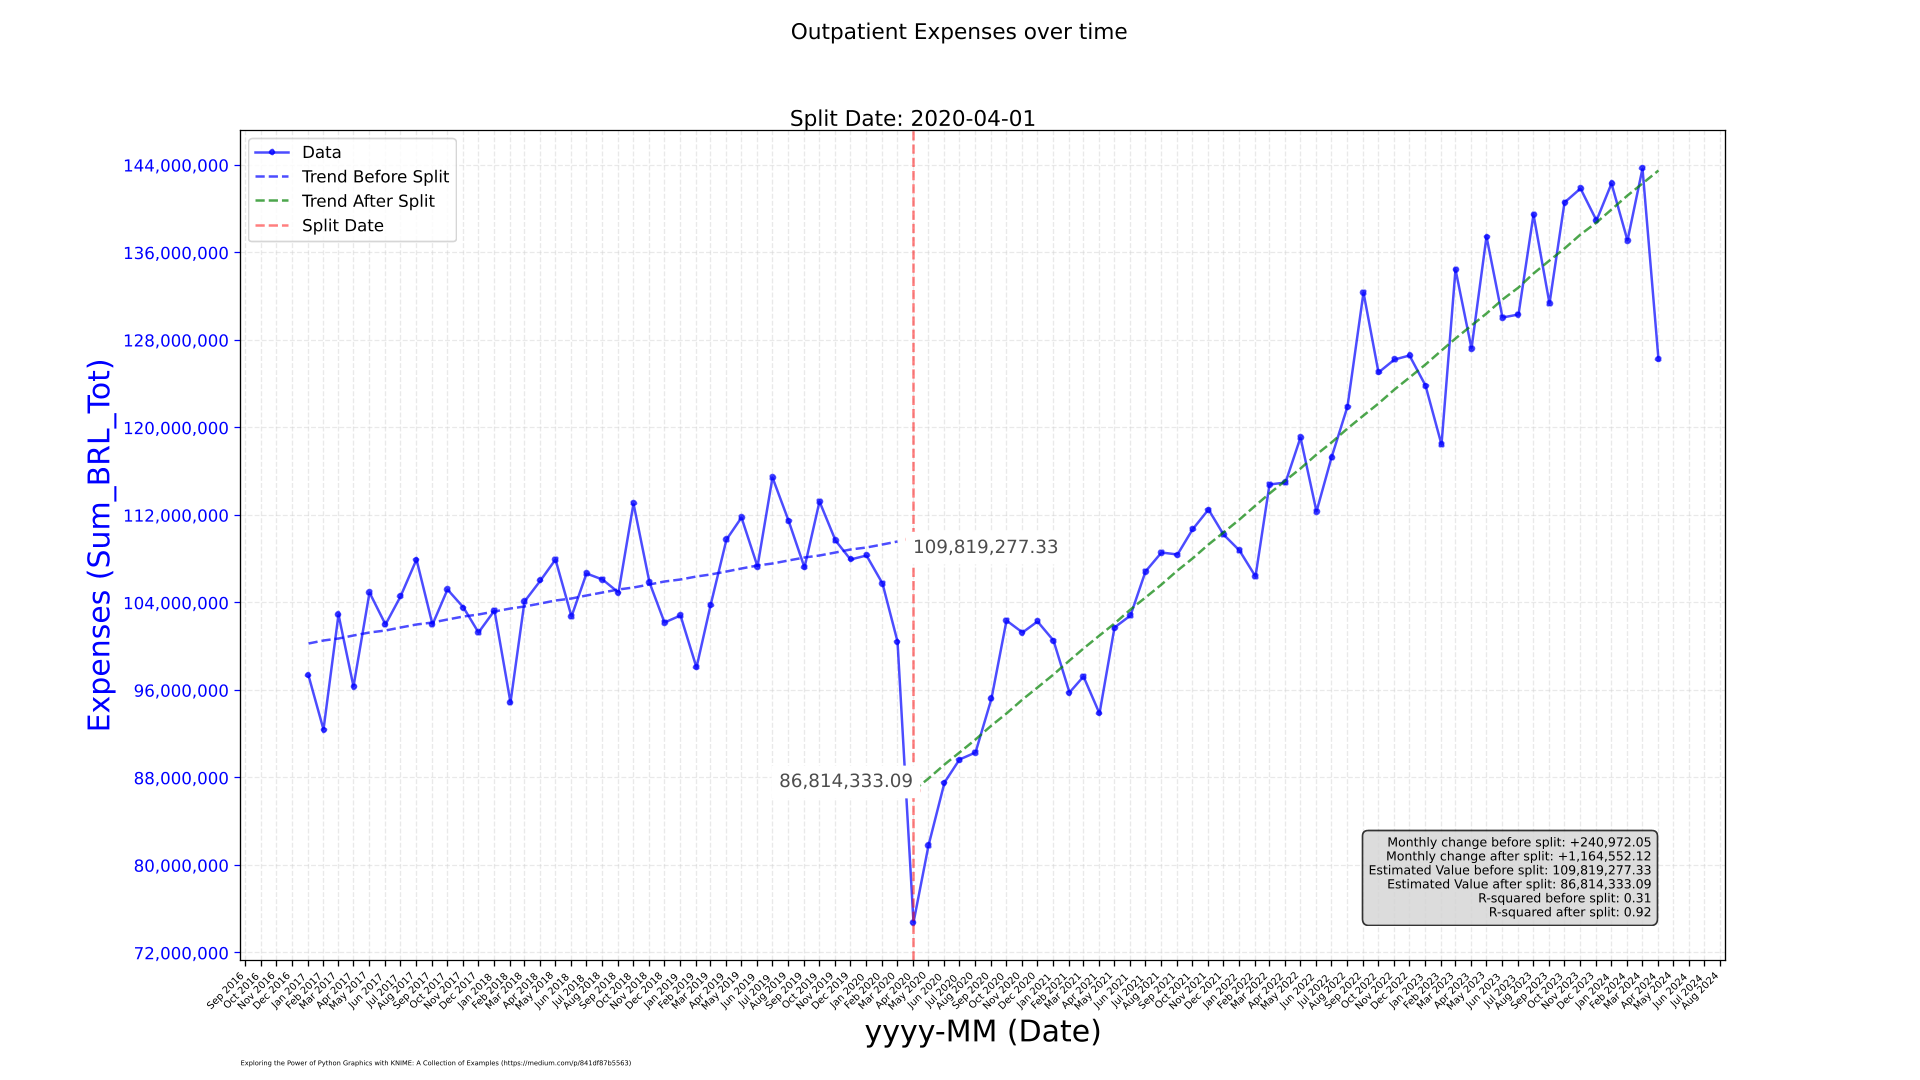
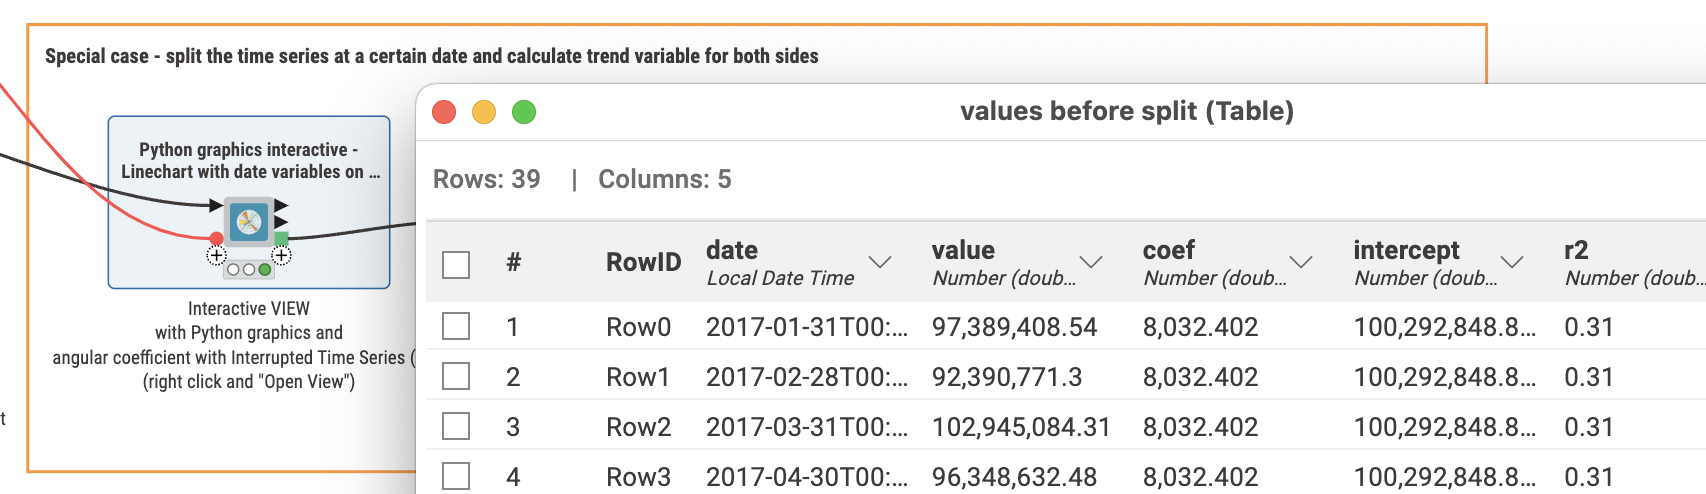
The component would also provide the split data aggregated to month (or days if you have such data) as KNIME tables so you better could check if the calculation is correct.
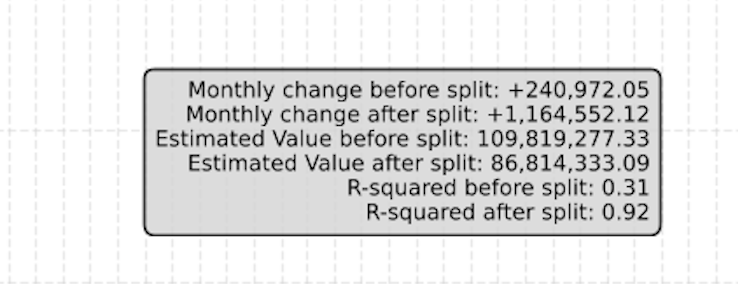
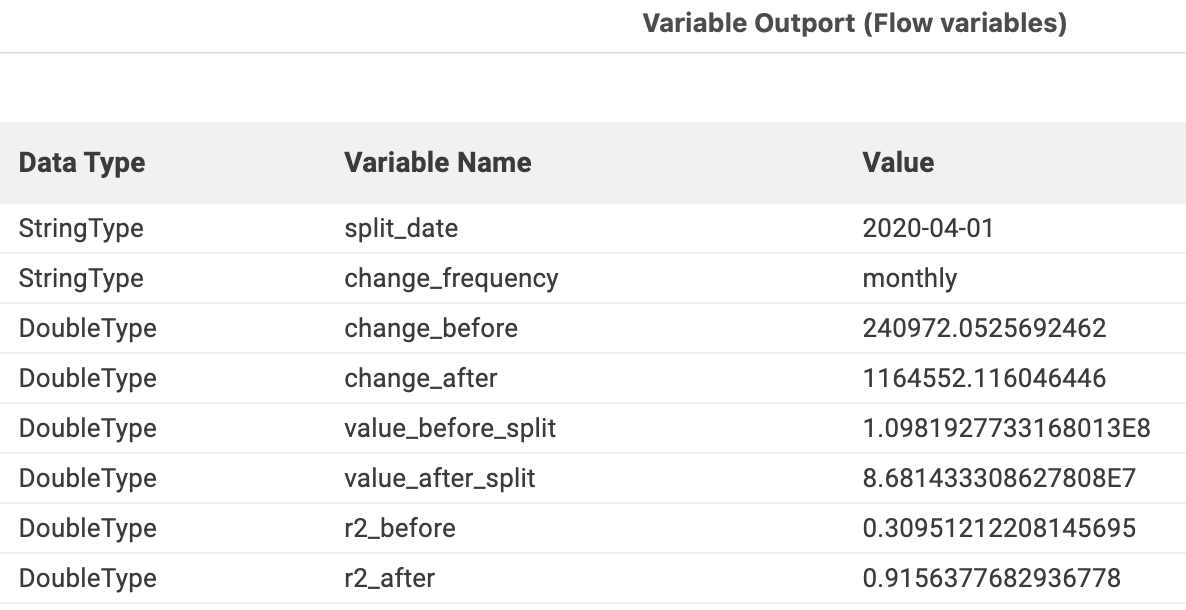
The coefficients would also be present in the data as well as a Flow Variables so they can be used further.
Maybe you can tell me what you think. Even if you do not want to use Python (which I can understand).
This would just demonstrate how with a limited effort and in this case the help of ChatGPT and Claude AI such a system can be set up. One will have to be careful and see if the calculations made are the right ones. There is an argument to do this step by step with KNME nodes so to have a better understanding and documentation about what is going on. Our finance guys like to do this so as to be able to explain every step to someone not immediately familiar with the topic and always be able to see the intermediate results.
To do this would mean to have a clear definition of what the formulas should be.
If you want to use the data in Excel why not just export it into Excel with the help of KNIME (there is an excel file in the /data/ folder of the workflow).