Hello. Im working on a project for predicting machine failure.
i have a numeric data of the reading state of one device and 5 sensors in
every one hour for two years.
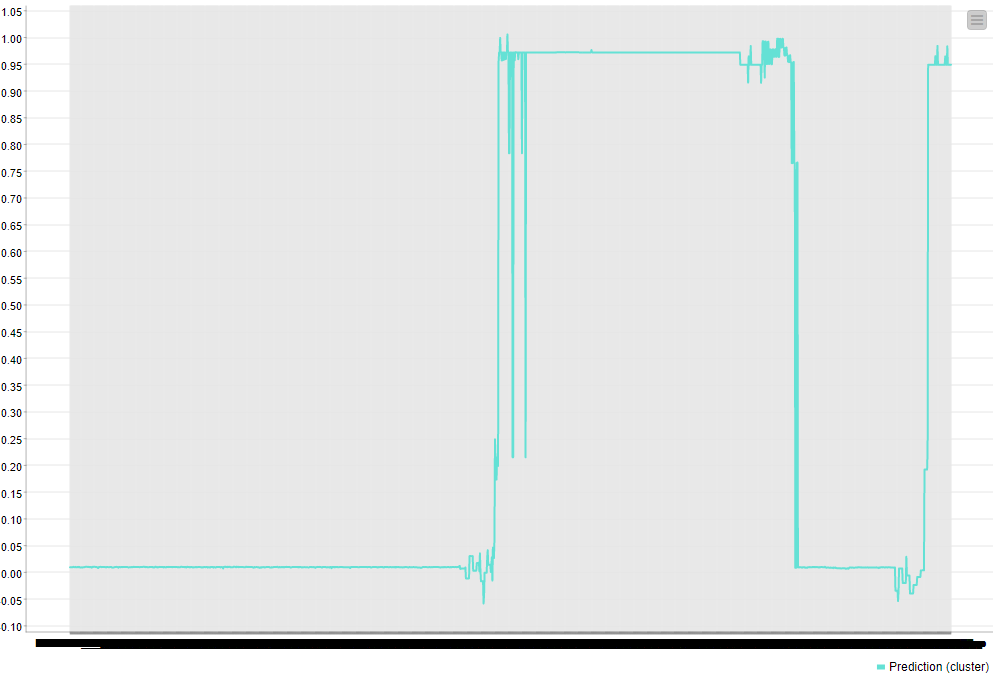
The result should be a line graph indicating that if the line
stays below zero the machine is normal and if it reach 1 the machine
is close to failure, if it is in between, it is a phase where predictive maintenance should took place.Lower limit is zero and upper limit is 1.
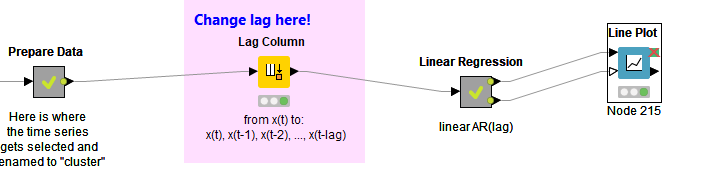
i use linear regression but i didn’t get the result i want.where did i went wrong?
if i plan on changing the method into decision tree, will it work? and can you suggest
ways to do it? Please help me  Thank you!
Below is the result that i got:
Hello @Nasha_Ayuni,
if the range of your outputs is [0,1] where 1 means a failure, you could treat your problem as a binary classification task, where the probability of failing p(f) is given your original value and the probability of not failing is 1-p(f).
With 4.1.0 we introduced the Nominal Probability Distribution Cell which can be used to model such probabilities and you can then use the Logistic Regression or Gradient Boosted Trees nodes to do your prediction.
Cheers,
Adrian
1 Like
Hyee! Is the workflow correct?
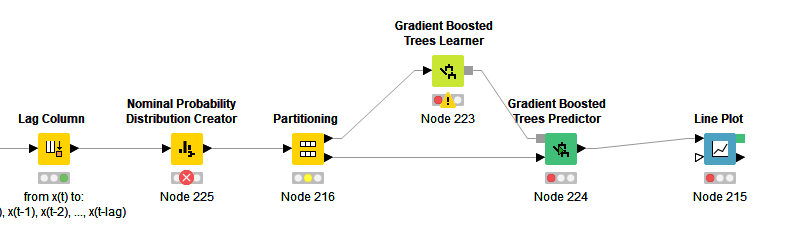
why at the node nominal probability distribution says i have missing value when i didn’t?
Appreciate your help 
Hi,
that’s hard to tell without seeing your data.
It looks like the only thing you changed is the Nominal Probability Distribution Creator. In your setting you only have the probability of the positive class p(f) and you need to create the probability of the negative class which is 1-p(f) using the Math Formula node.
Cheers,
Adrian
1 Like
Hyee! i see. can i know the formula to calculate the neg class in the math formula node?
I already provided it, it’s 1 - p(f), where you have to substitute p(f) with the column holding your current target value.
Knime has white papers concerning anomaly detection in machines. Maybe you could try to adapt an example.
1 Like
Hello there! Thank you for your help. By the way, in line plot it only shows the rows in y axis and the reading of the limit (1 till -1) in x axis. How do i show the date of the machine having breakdown in line plot?
Hello! I have the result of actual and prediction line graph in a line plot node. How do i calculate
the accuracy, precision, correlation and dependency between those two?
This topic was automatically closed 182 days after the last reply. New replies are no longer allowed.