In the last two months we’ve been working with a mostly volunteer team on helping out a grand endeavour, completely repairing the human heart. The part our team has been working on has now hit a roadblock. We’d like to ask for some help from a willing mathematician with image analysis experience to get us back on track. Can you help?
We’ve been trying to analyze the tissue from heart valves to determine the quality of this heart valve. What we have is thin slices of heart tissue that have been coloured with 2 different stains. The tissue is so thin that it is transparent under the microscope, so we have coloured it. One colour measures the protein that we are looking for and the other colours all tissue so that we can see the contours of the tissue. We think we can determine the quality of the tissue by verifying how widespread this protein has gone. More of it means a further deterioration of the valve.
As a team we have used a few existing analyses, and transported those into Knime so we can reuse them. Unfortunately we are not getting exactly what we need and now need to understand the mathematics of it all in order to tweak and tune our processes. We have 2 software developers on board and a tissue engineer, but are lacking the mathematical knowledge to get this analysis tuned. Below you will find as brief as possible an explanation of our process and a whole load of questions. Would be very helpful if someone can take the time to help us through this!
The chemical process
Normally, a slide is washed in an antibody (The Primary Antibody) that specifically binds to the protein in which we are interested. After the excess liquid is removed, the slides is then washed with a different antibody (the Secondary Antibody) which is tagged with a chemical to provide another color (in this case, Alkaline Phosphatase, in purple), which will attach to the Primary Antibody and make the protein visible. After both antibody stains, the slide is then washed with the counterstain (in this case, Nuclear Fast Red, the magenta color, which is used to see cell nuclei, but colors all the biological tissue). The slide is then washed of the excess stain, dehydrated, and sealed with a slide cover. The first quadrant below is the result of this.

Our analysis
We ran a grayscale histogram of the full image and then did a colour deconvolution, ported from Gabriel Landini’s awesome work (Colour Deconvolution – Novel context-based segmentation algorithms for intelligent microscopy) The result of that is in the second, third and fourth quadrants. We got to that by selecting two small regions from the full colour image in order to get reference values. These regions however always have both colours present in them. We got a decent separation from that, so we ran the histograms on that, but they look confusing to us:
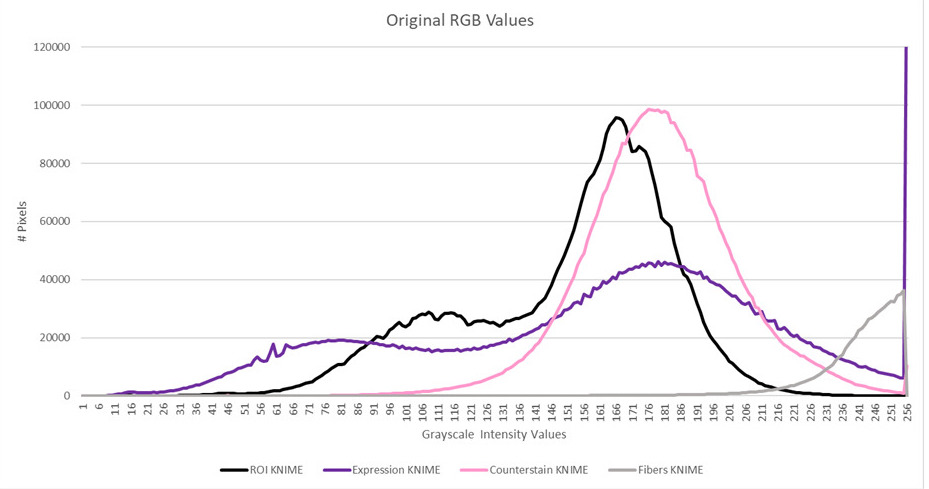
Why is the histogram curve for expression spread out wider over all of the intensities than the original histogram curve? Why did the peak of counterstain go to the right of the original curve? Is this to do with the method we chose for the grayscaling?
Improvement expected
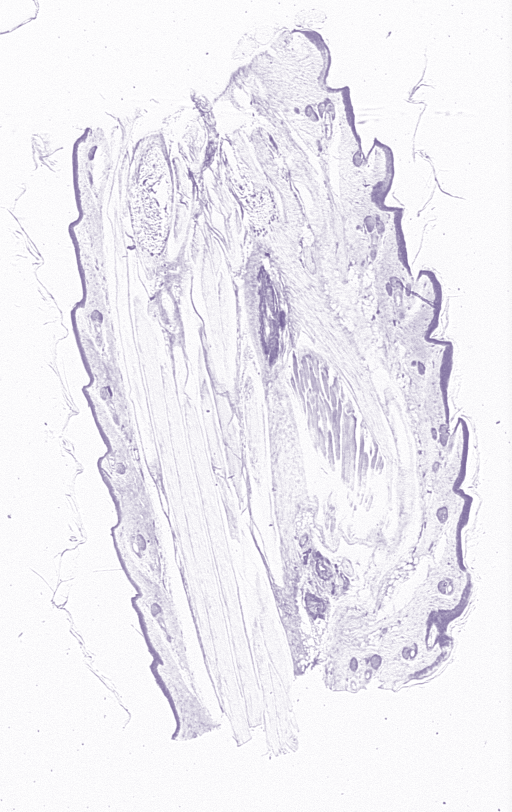
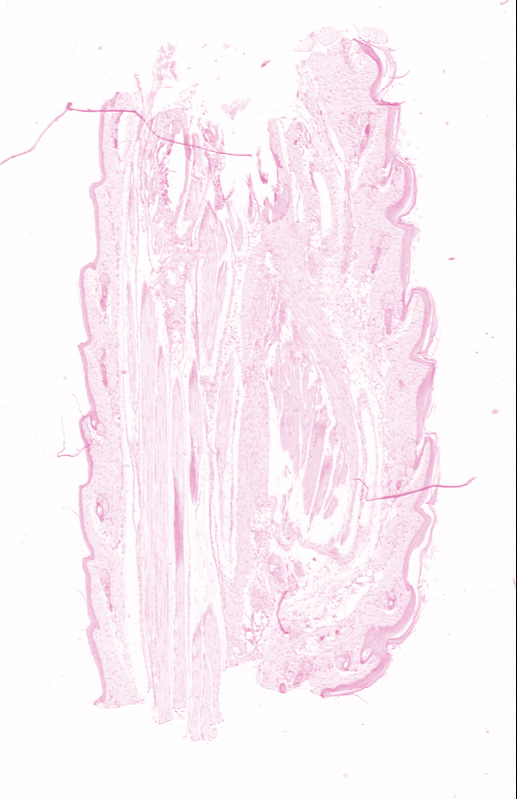
We thought we could improve the process by taking deconvolution values from single stained images. Our tissue engineer took a sample with the expression stain and a sample with the counterstain.
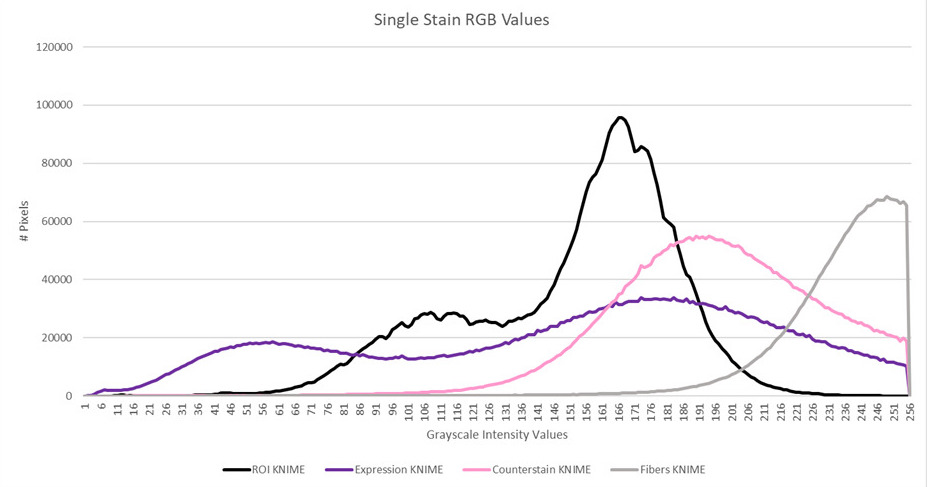
We then ran that through the Colour Deconvolution algorithm. Suddenly we get a far worse colour deconvolution, completely opposite from what we expected. The third image, the remainder, contains many more pixels. What are we doing wrong here? Choosing the wrong location in the image?

The histogram for this colour deconvolution also confirms that we have something worse instead of better.
Basically we are playing with forces we don’t completely comprehend and would love for someone to educate us, or even better, help us out with this. Are you that person?
Look forward to hearing from you!
–
Martin van Dijken
M +31 (0)6 26 144 223
E martin@van-dijken.eu
http://www.linkedin.com/in/sunsear
P.S. This is a crosspost from the ImageJ forum as this concerns both groups: Math Analysis assistance requested for determining the amount of expression on image - Image Analysis - Image.sc Forum