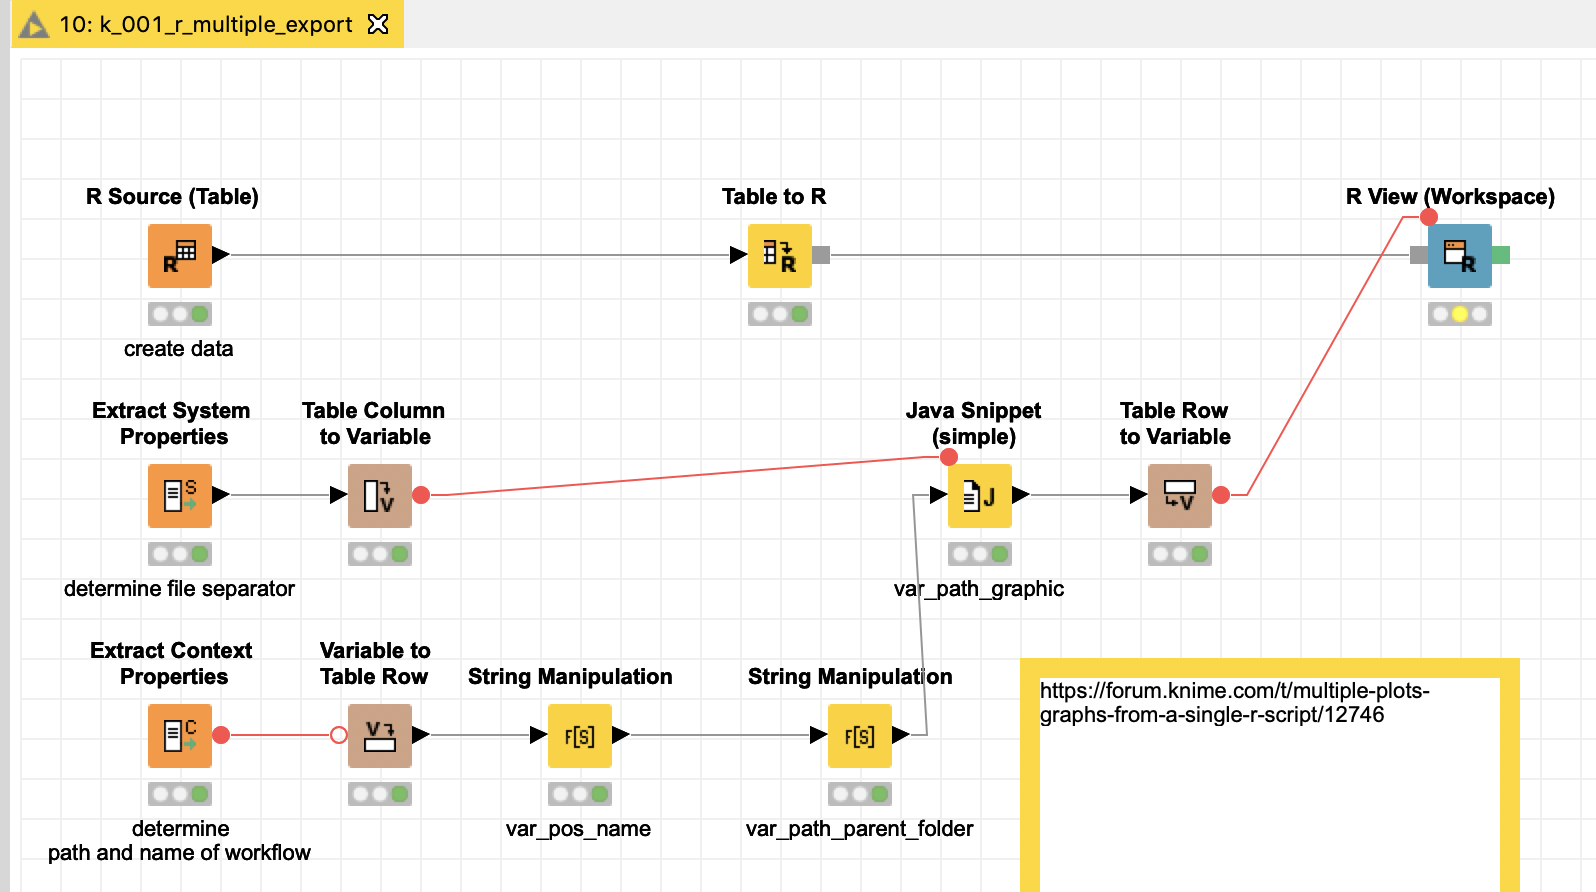
You could determine a local path and then tell R to save various graphics in a row. I attached an example workflow that does that. You might use that as a starter.
The R View shows one plot but saves more than one. I tried that with just a R scrip node but it gave me an error message.
library(ggplot2)
https://www.andrewheiss.com/blog/2016/12/08/save-base-graphics-as-pseudo-objects-in-r/
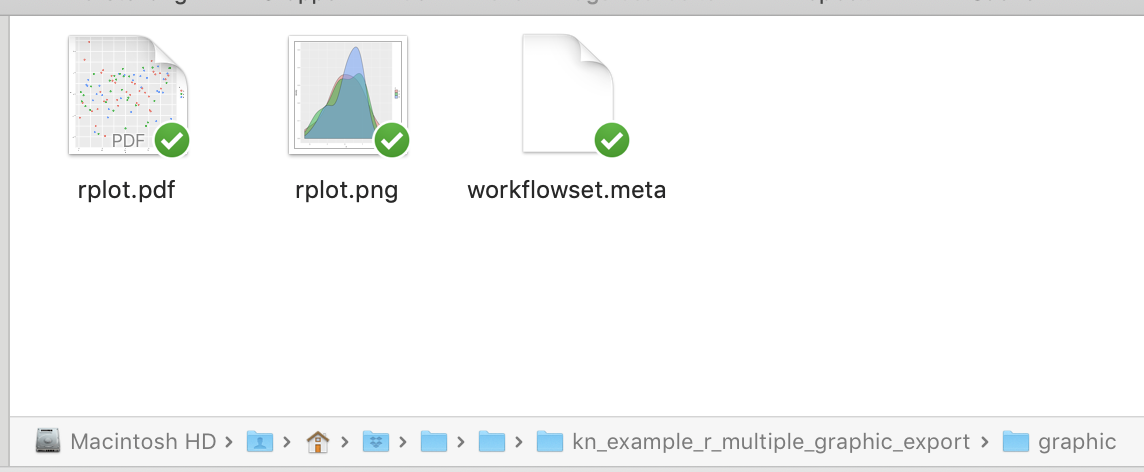
var_name_pdf_file <- paste0(knime.flow.in[[“var_path_graphic”]], “rplot.pdf”)
var_name_png_file <- paste0(knime.flow.in[[“var_path_graphic”]], “rplot.png”)
Scatterplot
p1 <- ggplot(rframe, aes(x=x, y=y, color=z)) + geom_point()
Distribution
p2 <- ggplot(rframe, aes(x=y, fill=z)) + geom_density(alpha=0.5)
ggsave(p1, filename=var_name_pdf_file)
ggsave(p2, filename=var_name_png_file)
kn_example_r_multiple_graphic_export.knar (241.5 KB)