Prediction on qualitative data

First of all: I am no statistician, so I could be asking a completely stupid question here!

Is there a way that Knime can predict an outcome based on qualitative data? I notice (for obvious reasons) that a lot of the example prediction workflows use numeric data, but I wondered if there is one which may work for qualitative data, too? Below is a completely made up dataset with certain qualities of a group of people.

image

Ideally, I would like to be able to predict which group (the final column) new people coming into the dataset are likely to be in. Is that at all possible? Thanks in advance!

Hi @JWebb , categorical values can be converted with the Rule Engine Node to dummy numbers. Once converted, you can perform your desired test.

3 Likes

@JWebb a more advanced method could be to use label enconding for string variables if that is suitable. If you want to 9indicate a trend you could use positive and negative values or give “Pos” category a higher value than negative.

If you have very different numerical variables (the scale is very different) you might want to think about techniques like normalization or use a logarithmic transformation.

2 Likes

Which algorithm are you using? Trees can handle categorical data
br

3 Likes

I am not sure; I just set it up like the wine data workflow example! Where do I find that? I cannot see it in the node.

@JWebb you might benefit from taking a few courses and read an introduction to machine learning and check out a few examples:

Otherweise you might want to give use some more details about waht you want to do and mabye even a sample dataset that would not spill any secrets.

That’s part of my problem; though I do have a science background, I am not trained in statistics and I do not really know what to search for in order to learn. I can definitely mock up a dataset though and provide that. I will see what I can do :slight_smile:

Dummy data.xlsx (9.8 KB)

The idea here is that I would like to predict the “Answer” based on Gender, Age, and Demographic 1, 2 and 3.

However, when I put it through the decision tree, all answers are “No”, despite the fact I purposely set up so that 20 year-old, blue, positive, X females are all Yes. I have never been able to get this kind of workflow to predict anything but a blanket single value. There is never any variation in the prediction.

Given this dummy dataset, is it obvious what I am doing wrong? I can almost guarantee it’s something to do with me as I’m going into this a bit blind!

@JWebb you might want to take a look at this example using your data. Trained on random 80% the model is able to predict what you want. Though you have to be careful in this case the dataset is very small and might also be special. If you want to re-use such a model you will have to make sure you have the same structure again. You might also want to educate yourself about a cutoff point that would make sense. The nodes might suggest one but depending on your use case this might differ.

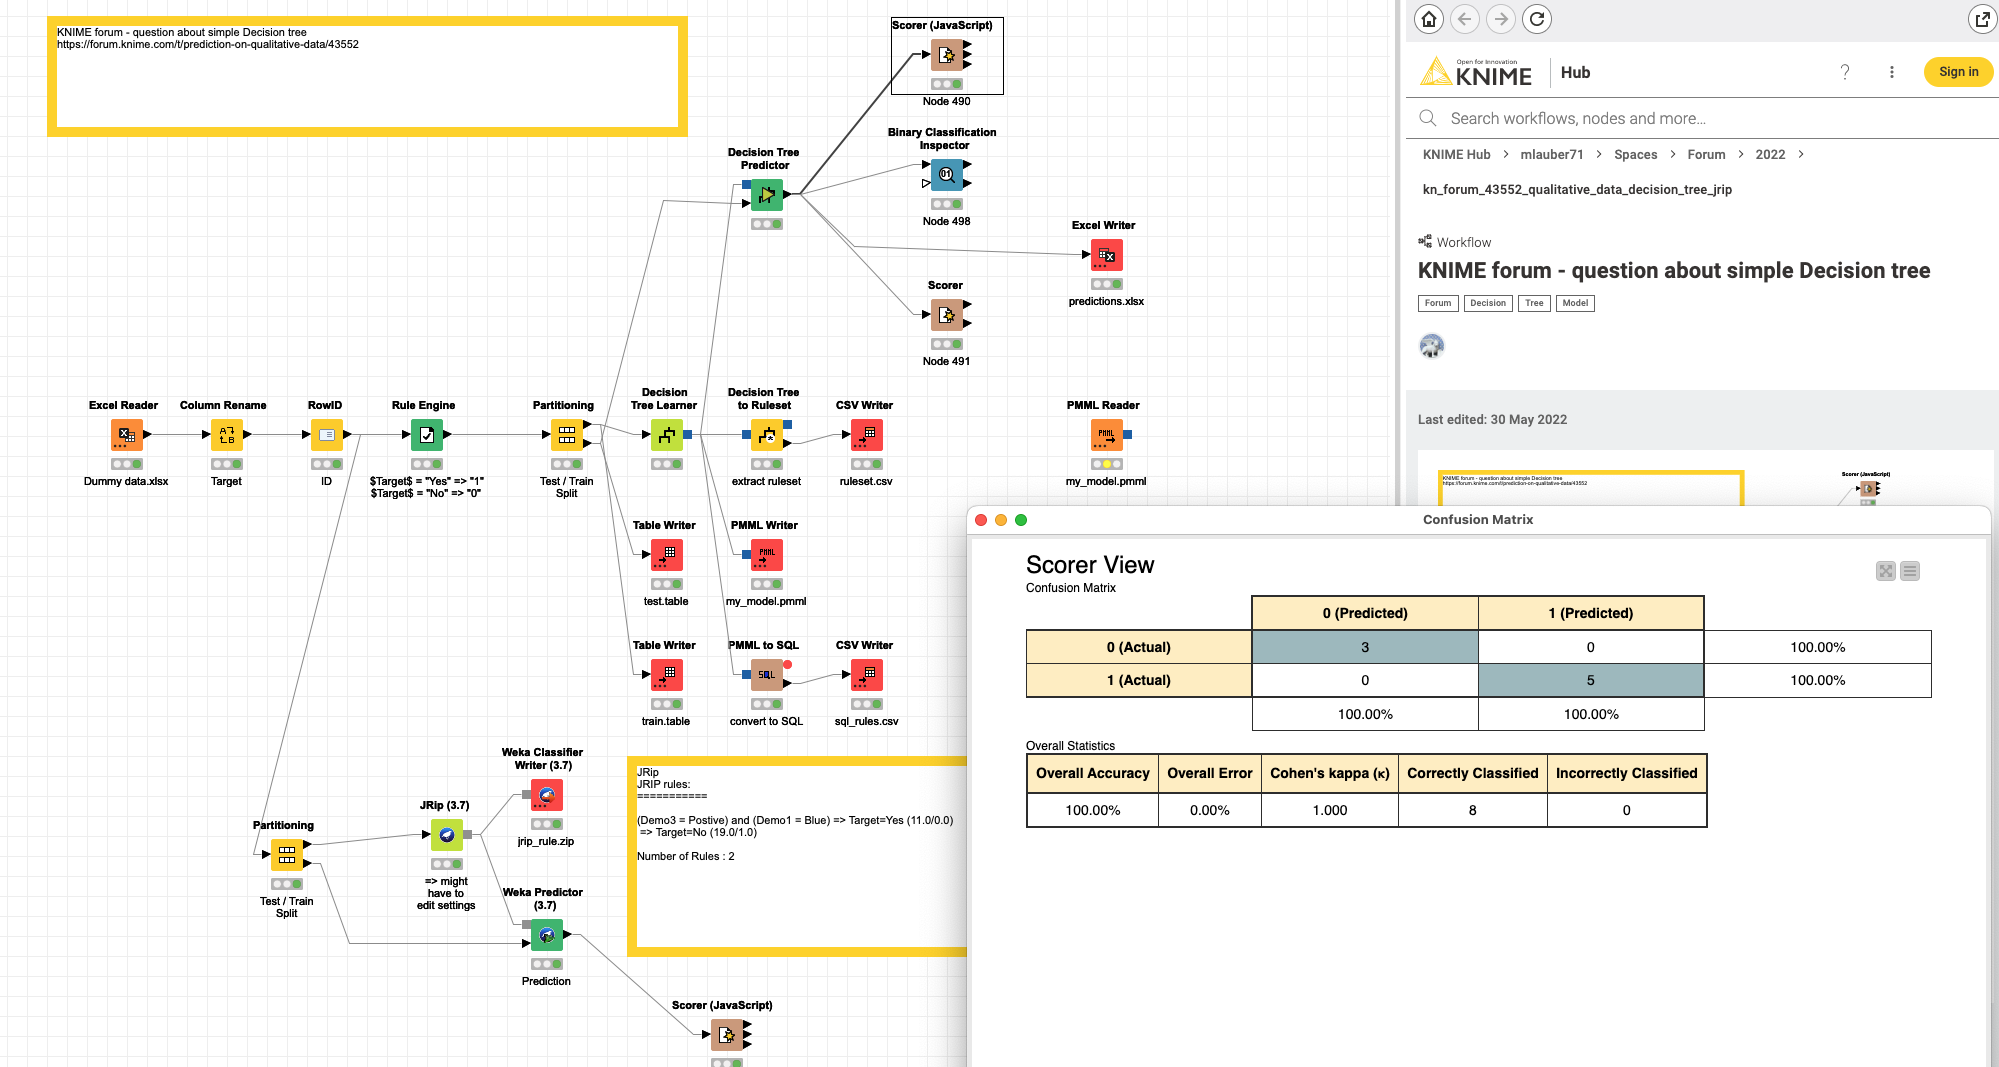
Another approach might be to try rule inductions - to maybe detect smaller groups. I have included one example. It might very well be that this rule in the end is only able to correctly determine one of your cases and the others are the ‘rest’. It very much depends on your data and use cases.

3 Likes

Brilliant, thanks for these resources! I will definitely look into them and apply them to my dataset and workflow and hopefully refine it further. Do you know of any simple resources for explaining how decision trees work? The ones I have found so far are quite crammed with statistics and formulae and I don’t think I am at that level of understanding quite yet. It would probably be useful for me to get a more solid idea of how they work in general before I go further.

1 Like

This topic was automatically closed 7 days after the last reply. New replies are no longer allowed.