Dear forum members. Please review attached document that describes requirements of analysis of requesting doctor’s presumptive diagnosis vs the final confirmed diagnosis by our specialists. PRESUMPTIVE vs FINAL DIAGNOSIS_KNIME.docx (2.0 MB)
Are there any available tools/nodes within KNIME that can provide the required information? Currently I am using a combination of Crystal reports, and MS Excel to provide some parts of the requirement…
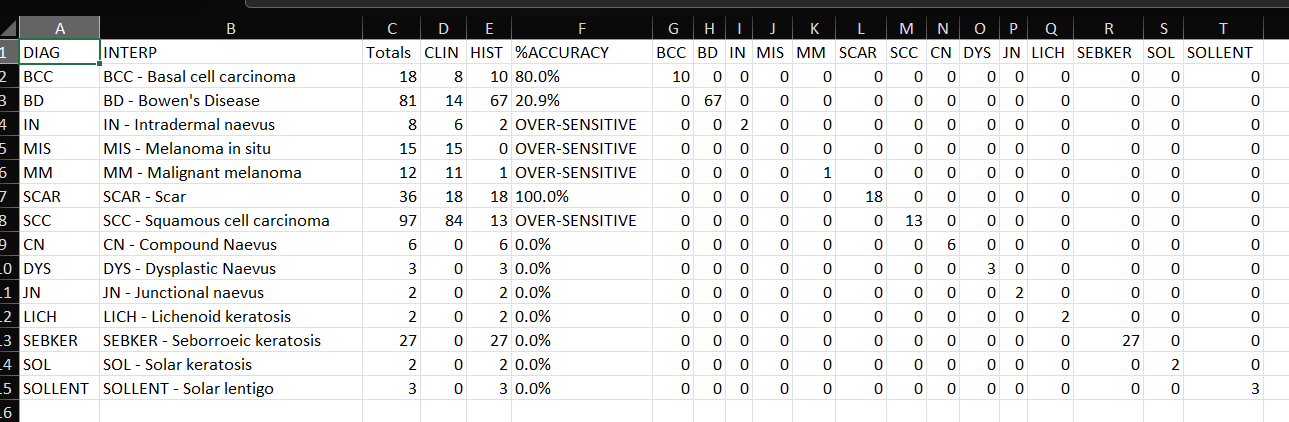
I saw the file and can say that the data can be validated as describe, so yes. I just need to report as results calculations that you have from a excel files (example) and show it as a table or graphic one. (math formula, groupby and rank nodes solve the questions).
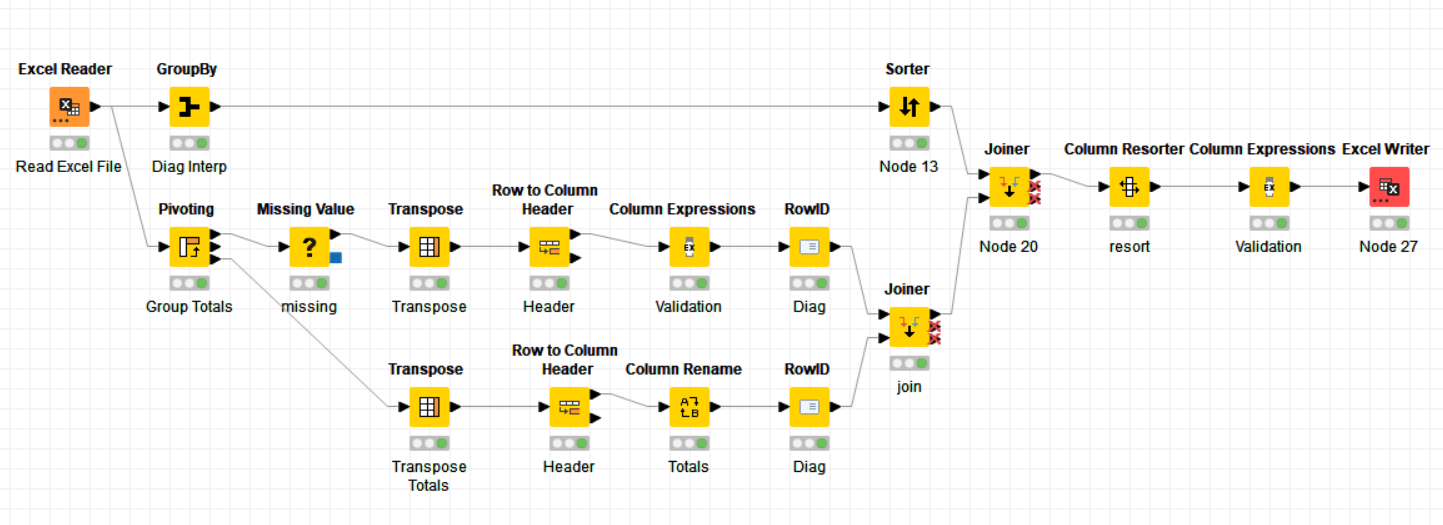
You’ll need to create a workflow with some nodes to make some calcs and then to bring the score, I don’t see problems with it and can be done quickly.
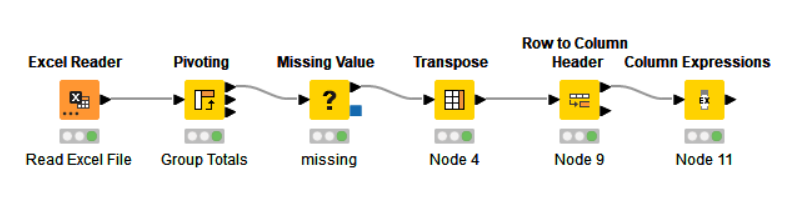
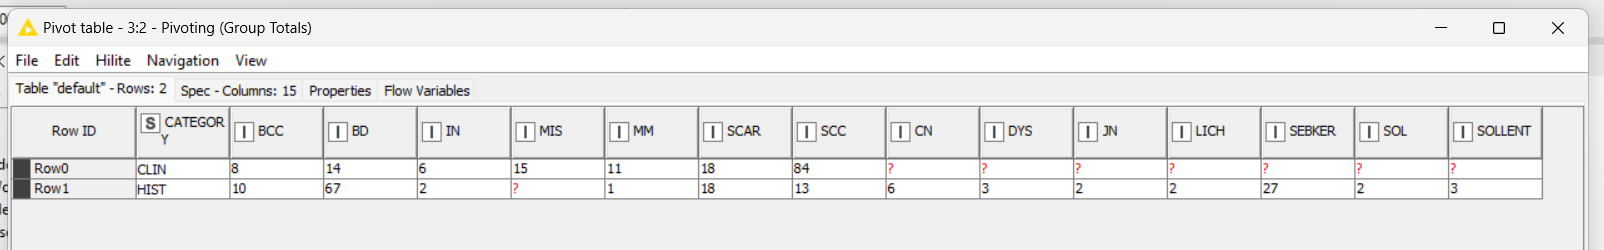
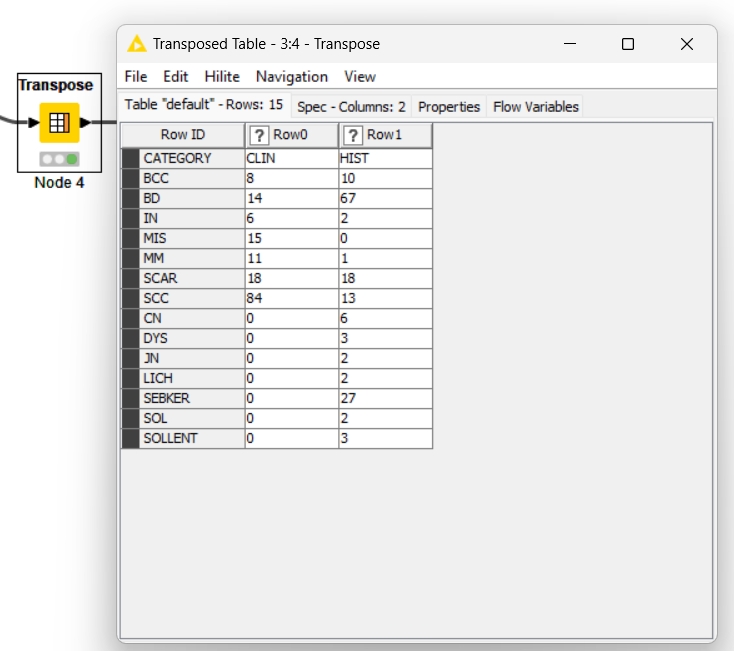
After that, you have 2 rows with the numbers and the category information, but you need to transpose it to vertical pivot and make calc at the end.
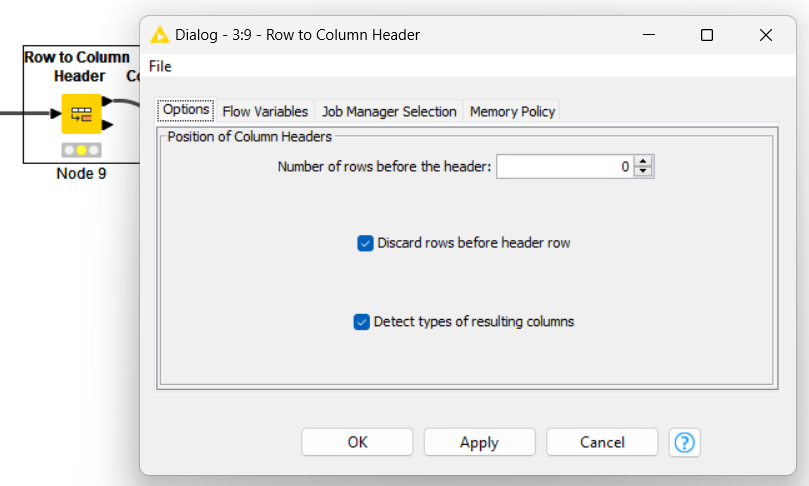
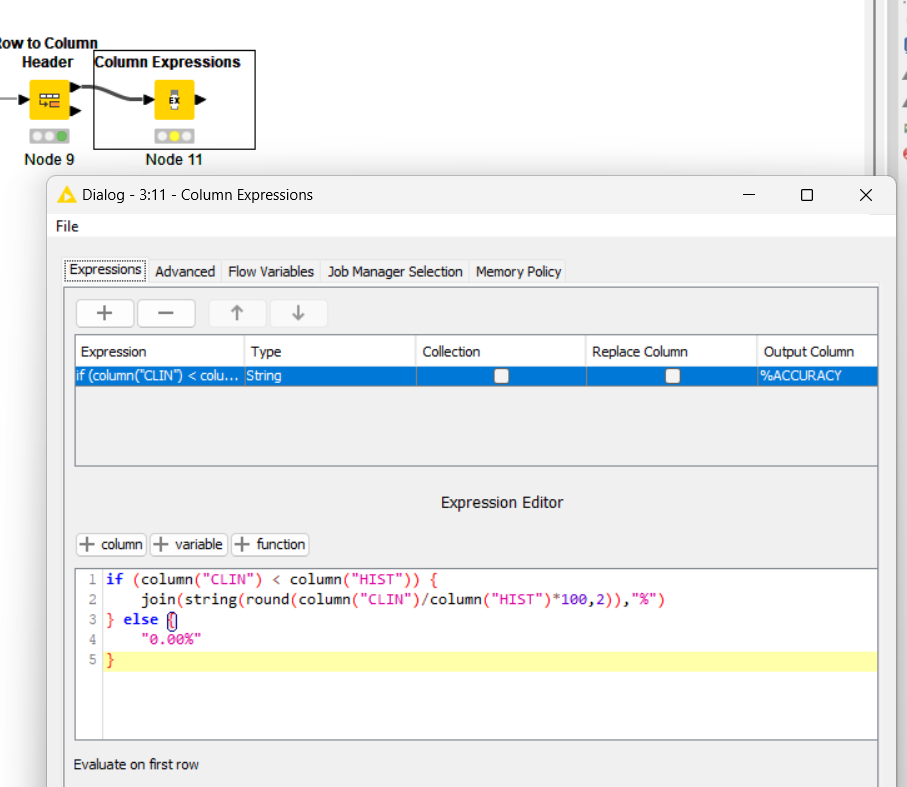
If you do that, Knime won’t recognize the column type because you have the category row and the numbers. As expected, you will use the first row as the table header, with the "Row to Column Header node’.
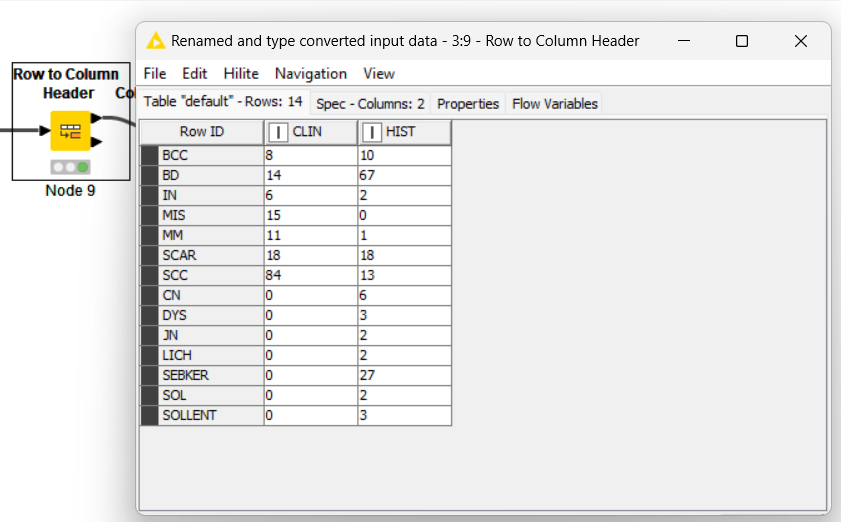
Now Knime will understand the values as numbers and you have a header to use as reference.
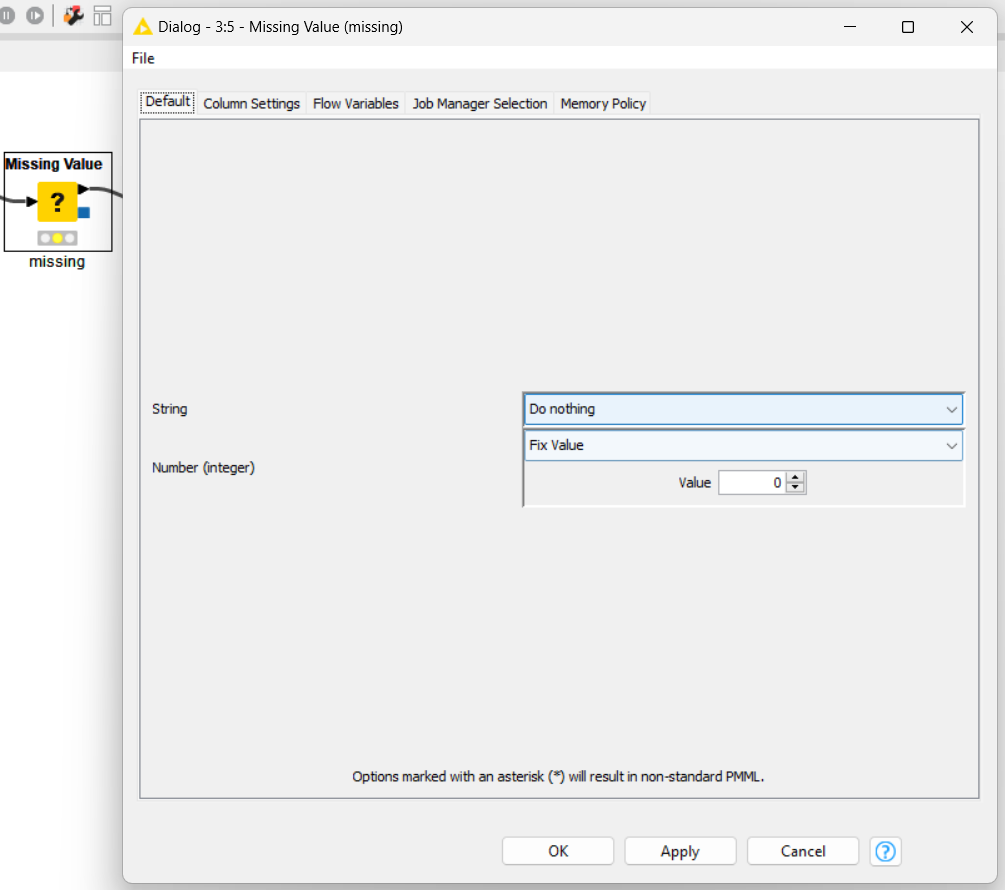
I use for this case the Column Expression node to make calc because you have a situation that the “HIST” number can be lower then “CLIN”, and de % of it will be a error like 1/0.
So, if “Hist” < “Clin”, I’ll set 0% for the accuracy.
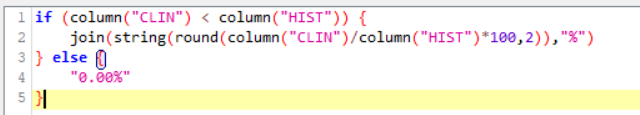
Thank you so much Denis. Certainly KNIME requires a bit of extra work as may be something you could possibly do with Excel, R Studio etc., but is certainly worth the effort to learn the nodes workflow. I have made a minor tweak to the formula in the Columns Expressions (see attached). Last phase of the project would be if it was possible to produce the results table matrix as per last page in this attached document?
Thank you Denis; this is not what we require, but we are getting closer. Please see attached document that illustrates further the workings of this matrix table and a quick example of the spreadsheet that I used for illustration. Hope this clarifies what we are after. Many thanks
Peter Results Matrix Table Example.xlsx (11.2 KB) Matrix Table Example Clarification.docx (1.5 MB)