@domerich welcome to the KNIME forum.
You can use local copies of the necessary bokeh libraries and even automatically load them from the source.

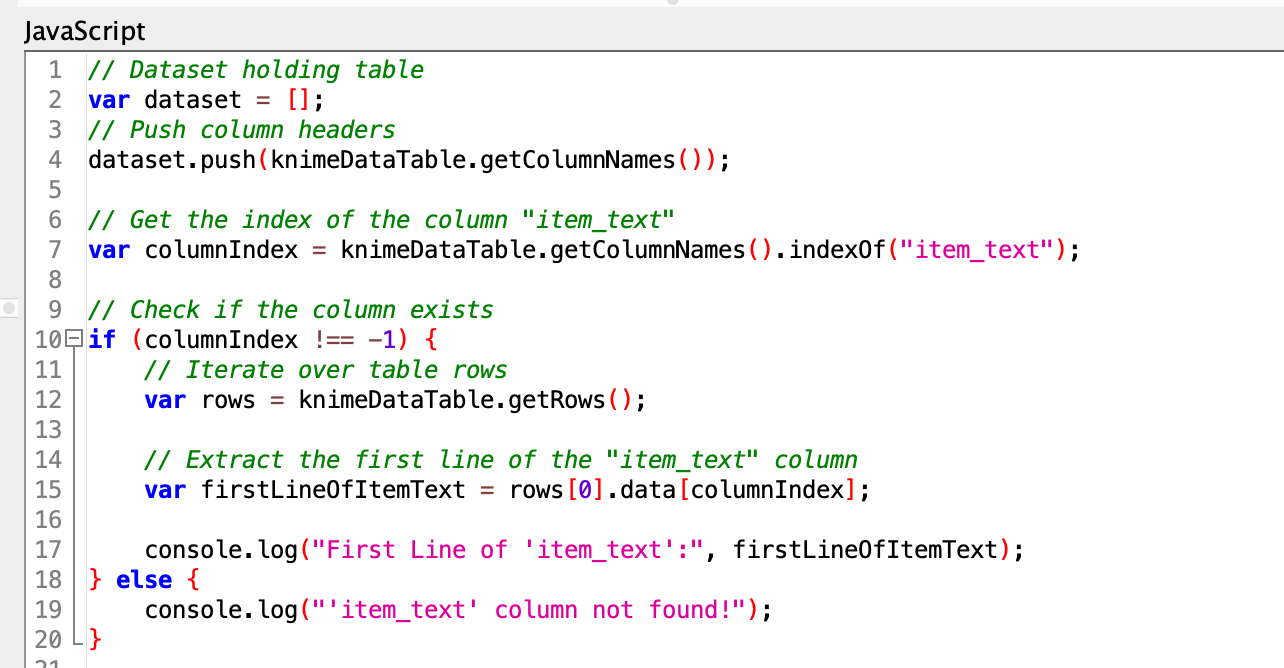
I have edited @st11 example and now send the JSON string via KNIME data stream to the graphic node. My impression was that the FlowVariable might not have enough characters for more complex charts. I also struggled with some binary data that sometimes was stored in the JSON string.
I was not able to properly export the result as a SVG (or PNG) file but you could manually download the data.
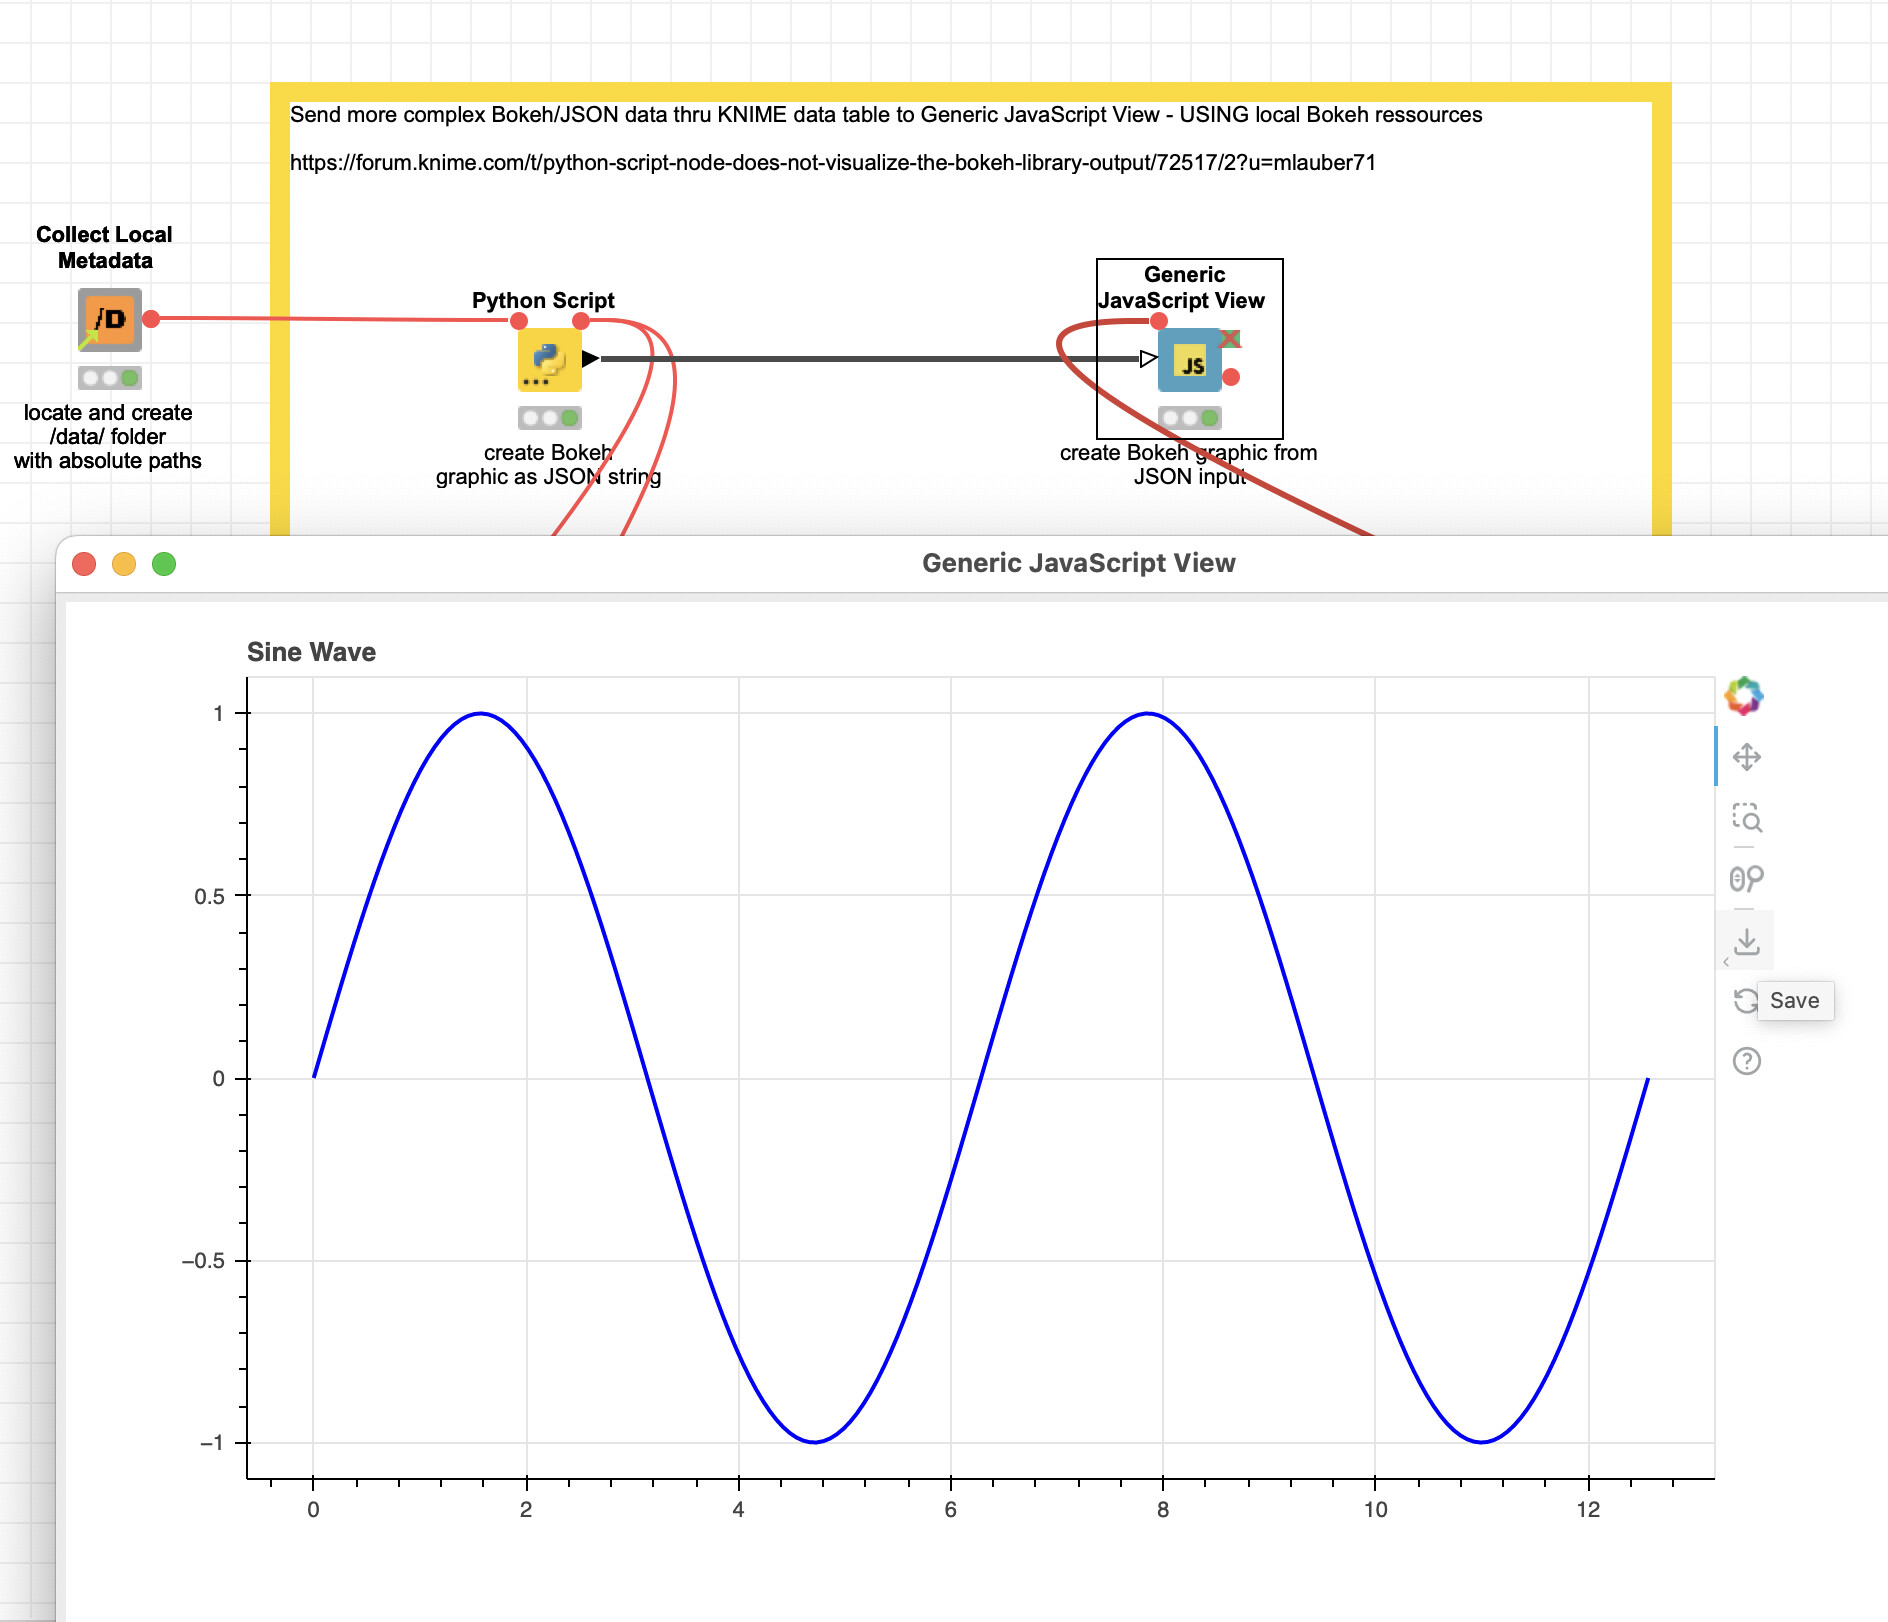
A nice experiment. I still would prefer the direct integration of Python graphics from Matplotlib and Seaborn (Create an Interactive Dashboard with KNIME Components and Python | by Markus Lauber | Low Code for Data Science | Medium) over the (for me?) quite complicated implementation via the Generic JavaScript View (JavaScript) – KNIME Community Hub.
kn_example_python_graphic_bokeh_json.knwf (707.3 KB)