I am trying to create a degradation model to forecasting the RUL using a dataset wich contain two columns: 1. Timestamp, 2. Vibration. The entire database is from july14, 2021 to august 02, 2021. The vibration data were taken each 1 second. I need some idea in order to obtain the prediction model in this case. Thanks.
Here I´m sharing the link with the file.
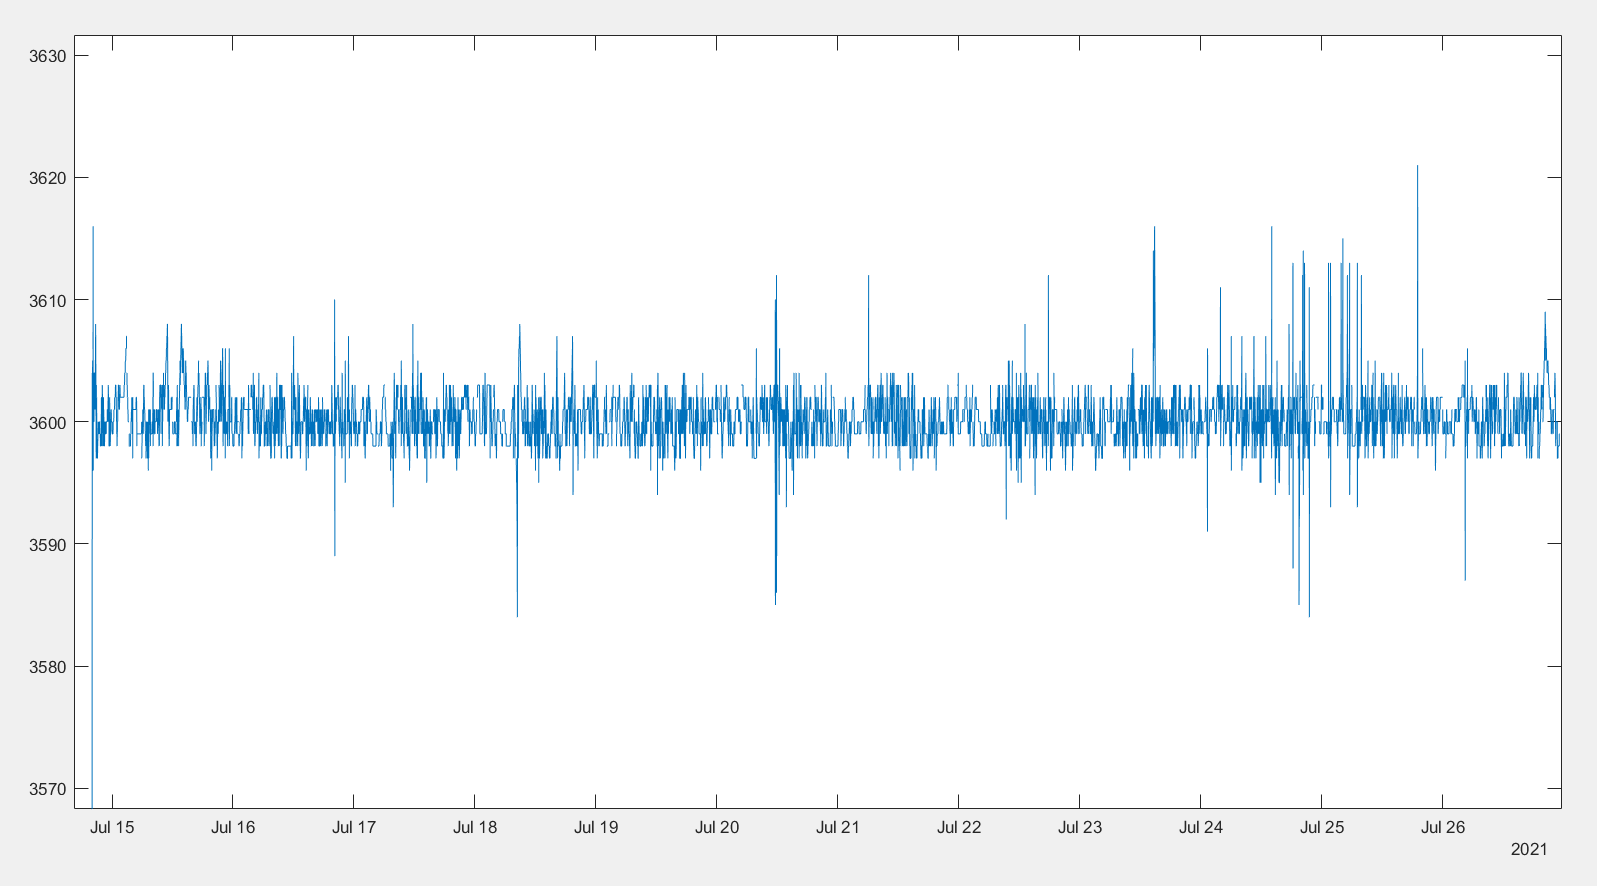
I have download the data you posted this morning. Here is a snapshot of how the RPM looks like, based on time:
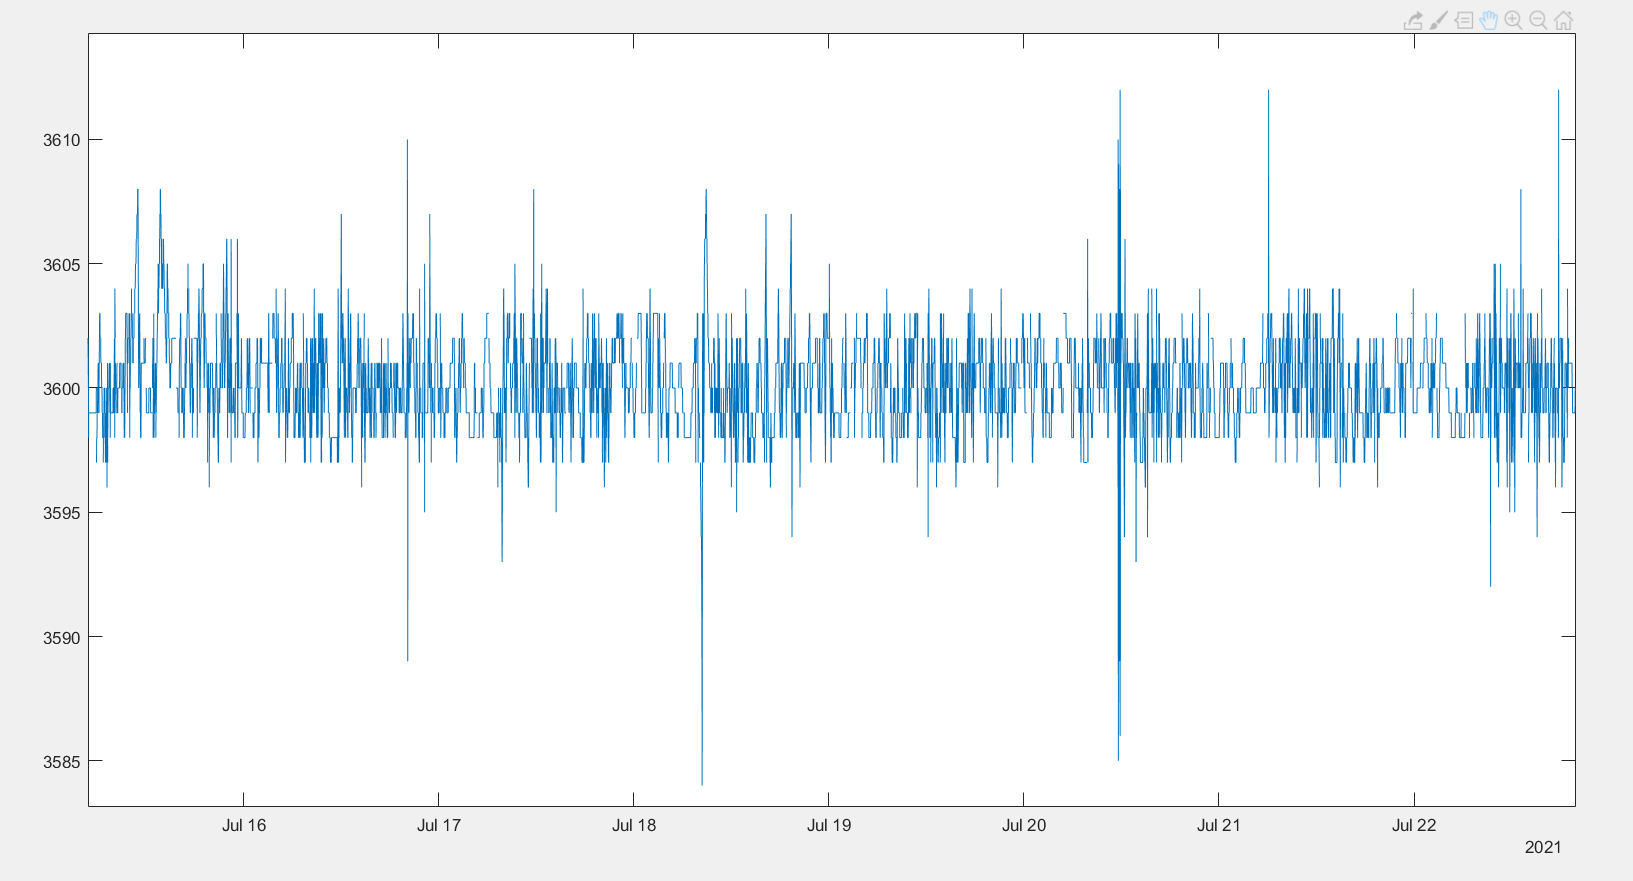
and a more detailed snapshot:
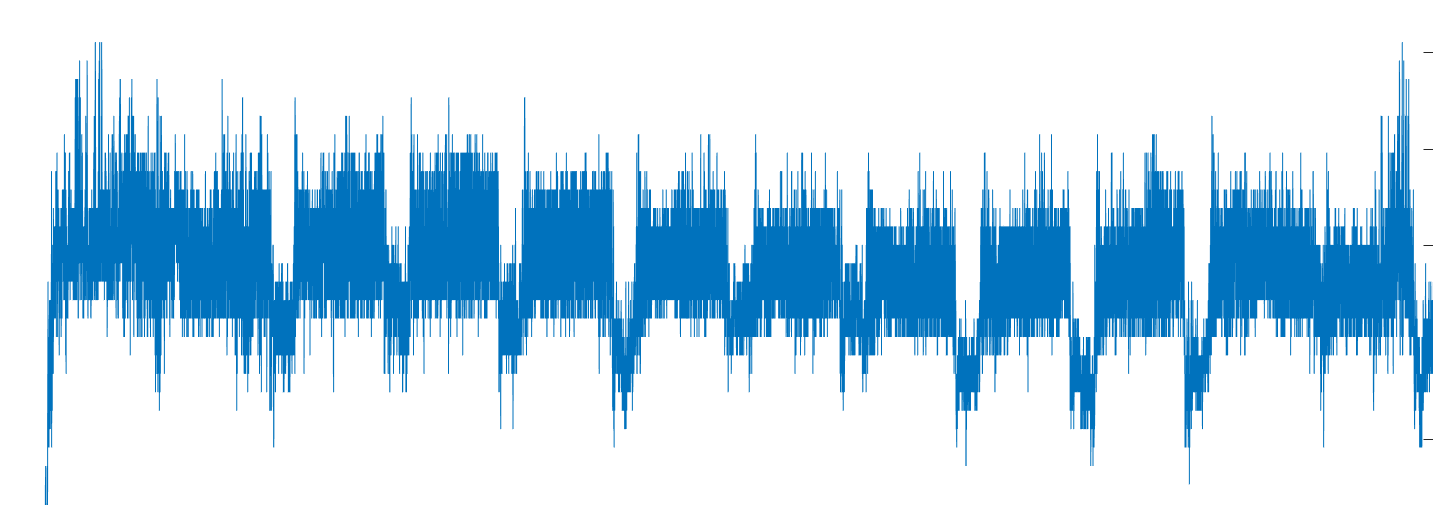
Also a snapshot of one of the vibrations (VelB1):
Could you please explain a bit more what you need to predict, for instance:
Do you need to predict the RPM value based on the 4 vibration columns ? In this case, at what time lag would this be ? Thanks.
Best
Ael
2 Likes
Hi:
No. My goal is predict the Time to Fail (TOF) or the Rest Useful Live (RUL) based in the VelB2 data. I have a threshold of 0.351in/s. The data is recorded each 1 second.
What is the time lag? I dont know about this.
Thanks!!!
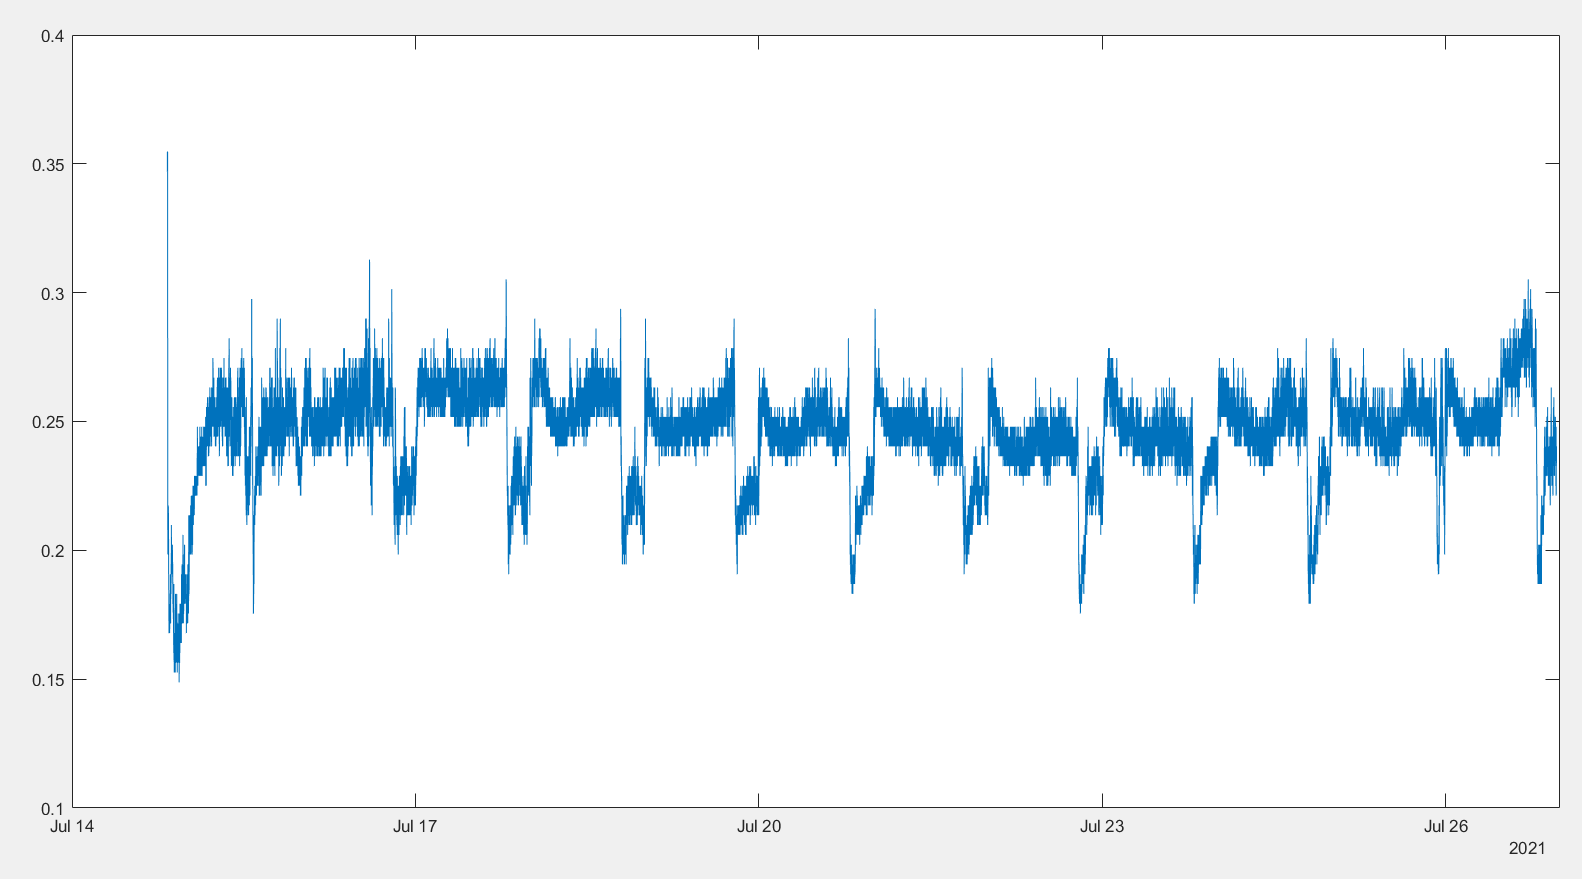
This is a snapshot of VelB2:
Could you please explain a bit what you call here the Time to Fail (TOF)? Where is this happening in your signal ? This is a generic forum and people are not necessarily familiar with your field terminology or data, even if some may have a Signal Processing background. Could you please clarify what in this VelB2 signal is the -Point Of Failure- so that the -Time Of Failure- can be predicted ? Thanks.
1 Like
Hi:
Maybe this could help to clarify the RUL concept:
Thanks…
The task you are going to solve is quite challenging.
I’m no data scientist or analyst but have some quite good unterstanding of maintenance. So failures and their prediction is by far not unknow to.
The basis of prediction if the PF-curve / PF-intervall https://limblecmms.com/blog/pf-curve-and-pf-interval/
So you want to do is to calculate this curve at (nearly) every point using the measured status.
What do you need for that purpose?
- First of all signals / data points which allow you to calculate the status.
In rotating equipment (RE) vibration is know to give quite good information for the detection of some (!) fault causes. But by far not for all causes. You should keep this in mind to understand the restrictions. - Secondly a sufficient high timely resolution of the measured signals
Vibration are high frequency signals. I’ve seen from data points in your file that the machines is running with at least 3600 rpm. That’s 60 rp second. So the signals themself might not have the required resolution.
Imagine a small break in the bearing. Lot’s of bearing balls will run 60 times per second over that point. So you will measure 60 peaks. When having a sample frequency of 1 second you might catch one of them. But it’s also possible that you take the sample all the time in between two of them. So no peak.
For detailed explanation on that you may take a look on Nyquist–Shannon sampling theorem - Wikipedia
That’s just for the basis of the calculation part.
What I’ve learned in my times in maintenance:
There exists lot’s of solutions on the market which analysis such high frequency signals to identify potential failures for RE. They work mostly quite good.
So what about low resolution information? Also here I know some solution which work on that base. But what they all do ist not taking a sample from time to time. All of them compress the hight frequency information by calculating several information like medium, high, low, deviation, … over each time frame.
I’m keen to learn that also your approach will give good results in terms of prediction. That would be a great step forward to much simpler failure prediction in this market.
And I’m sure that would be a great sales succes.
2 Likes
Hello, @knimediger:
That means what my data is not good for to predict the RUL?? Is that so??
What can I to do? Some idea??
Thanks
Please excuse my late response.
I’ve given you information about actual used technologies and the data used by these technologies.
This does not neccessarily mean, that is it impossible to do the same job with your type of data. But I’m not aware of such a solution right now.
At the moment I only know what you would like to predict the remaining usefull lifetime of some rotating assets.
Does this only mean that you would like to predict the “normal” lifetime?
Do you also want to identify and pedict failures?
If yes, what failures? I’m sure there are lot’s of different root causes which may trigger failures of these assets.
What is the criticality of these assets (to your “production” process)?
What are the associated costs for “normal” preventive maintenance?
How often do you see failures which you would like to identify and avoid by predictive maintenance?
Sorry for confusing you with many questions instead of a direct answer.
But in my daily work these are points which help to identify the right type of maintenance. That could be prediction but also run to failure.
You mentioned that the assets are turbogeneradors. According to the data you submitted they are running with 3600 rpm. That would mean that we are talking about 60Hz mains frequency.
Do you have additional data on hand to enrich the vibration data (load data, voltage, current, power, temperature, …)?
How long is the history of data you could use?
Does this history also cover data from failure events to compare good and bad status?
It could be worth to feed a suitable model with the data to see whether there is a chance to identify different status. And maybe you can at least predict some of the potential root causes for failures.
1 Like
Hi, @knimediger:
First, thank you for your help. I can observe that you have so much experience in the maintenance field.
Really, my interest is only to predict the Time to Fail or the Rest Useful Life based on the vibration (velocity in a bearing anti friction). There is a functioning threshold wich is 0.351 in/s. The failure causes are not investigation goals for now. The velocity of the turbine is 3600 rpm (60Hz), like you have mentioned.
I don’t have data from fails history. I can to get more data in order to be more long the collection period. No more.
Regards.
one question to the vibration data which you have on hand. I assume that you have already some vibration sensors on your machine(s). Is the recorded data just one sample/second? Or does this sensors give you a calculated value per second (e.g avg)?
That might be a step forward, especially if the sensor can in addition give more information (min/max/…) per second.
Maybe you can share more information about the sensor and it’s capabilities.
If there is a strict threshold for operation you might also try an approach to identify trends over peaks. This would allow you to calculate the distance to the threshold and maybe give some warning when approaching this limit. It’s just a try, but will not waste lot’s of energy and invest.
To calculate the RUL it would need some information about the degredation over time. I think that will not be a linear degradation^. So without any knowledge that may be nearly impossible to be calculated.
This topic was automatically closed 182 days after the last reply. New replies are no longer allowed.