@iCFO thank you!
So it basically boils down to: use “Call Local Workflow” Node which has the ability to generate reports if the called workflow has a BIRT report in it. It’s not nice, but it does the job.
I strongly agree that a “Report Output” Node is highly desireable.
That is the gist of it, but it requires a few tricks like JSON conversion, possibly column autocast or type conversion on the child side (+ looping for multiple reports). The JSON conversion can be seen in the @ipazin solution. All credit goes to the great Ipazin!
I also had a few tricks on this thread that I use to avoid errors and simplify version changes / testing in the child workflow report generator. Things like passing through the same JSON conversion before report building in the parent workflow, copy & paste techniques, creating a test data file to use within child workflow, etc.
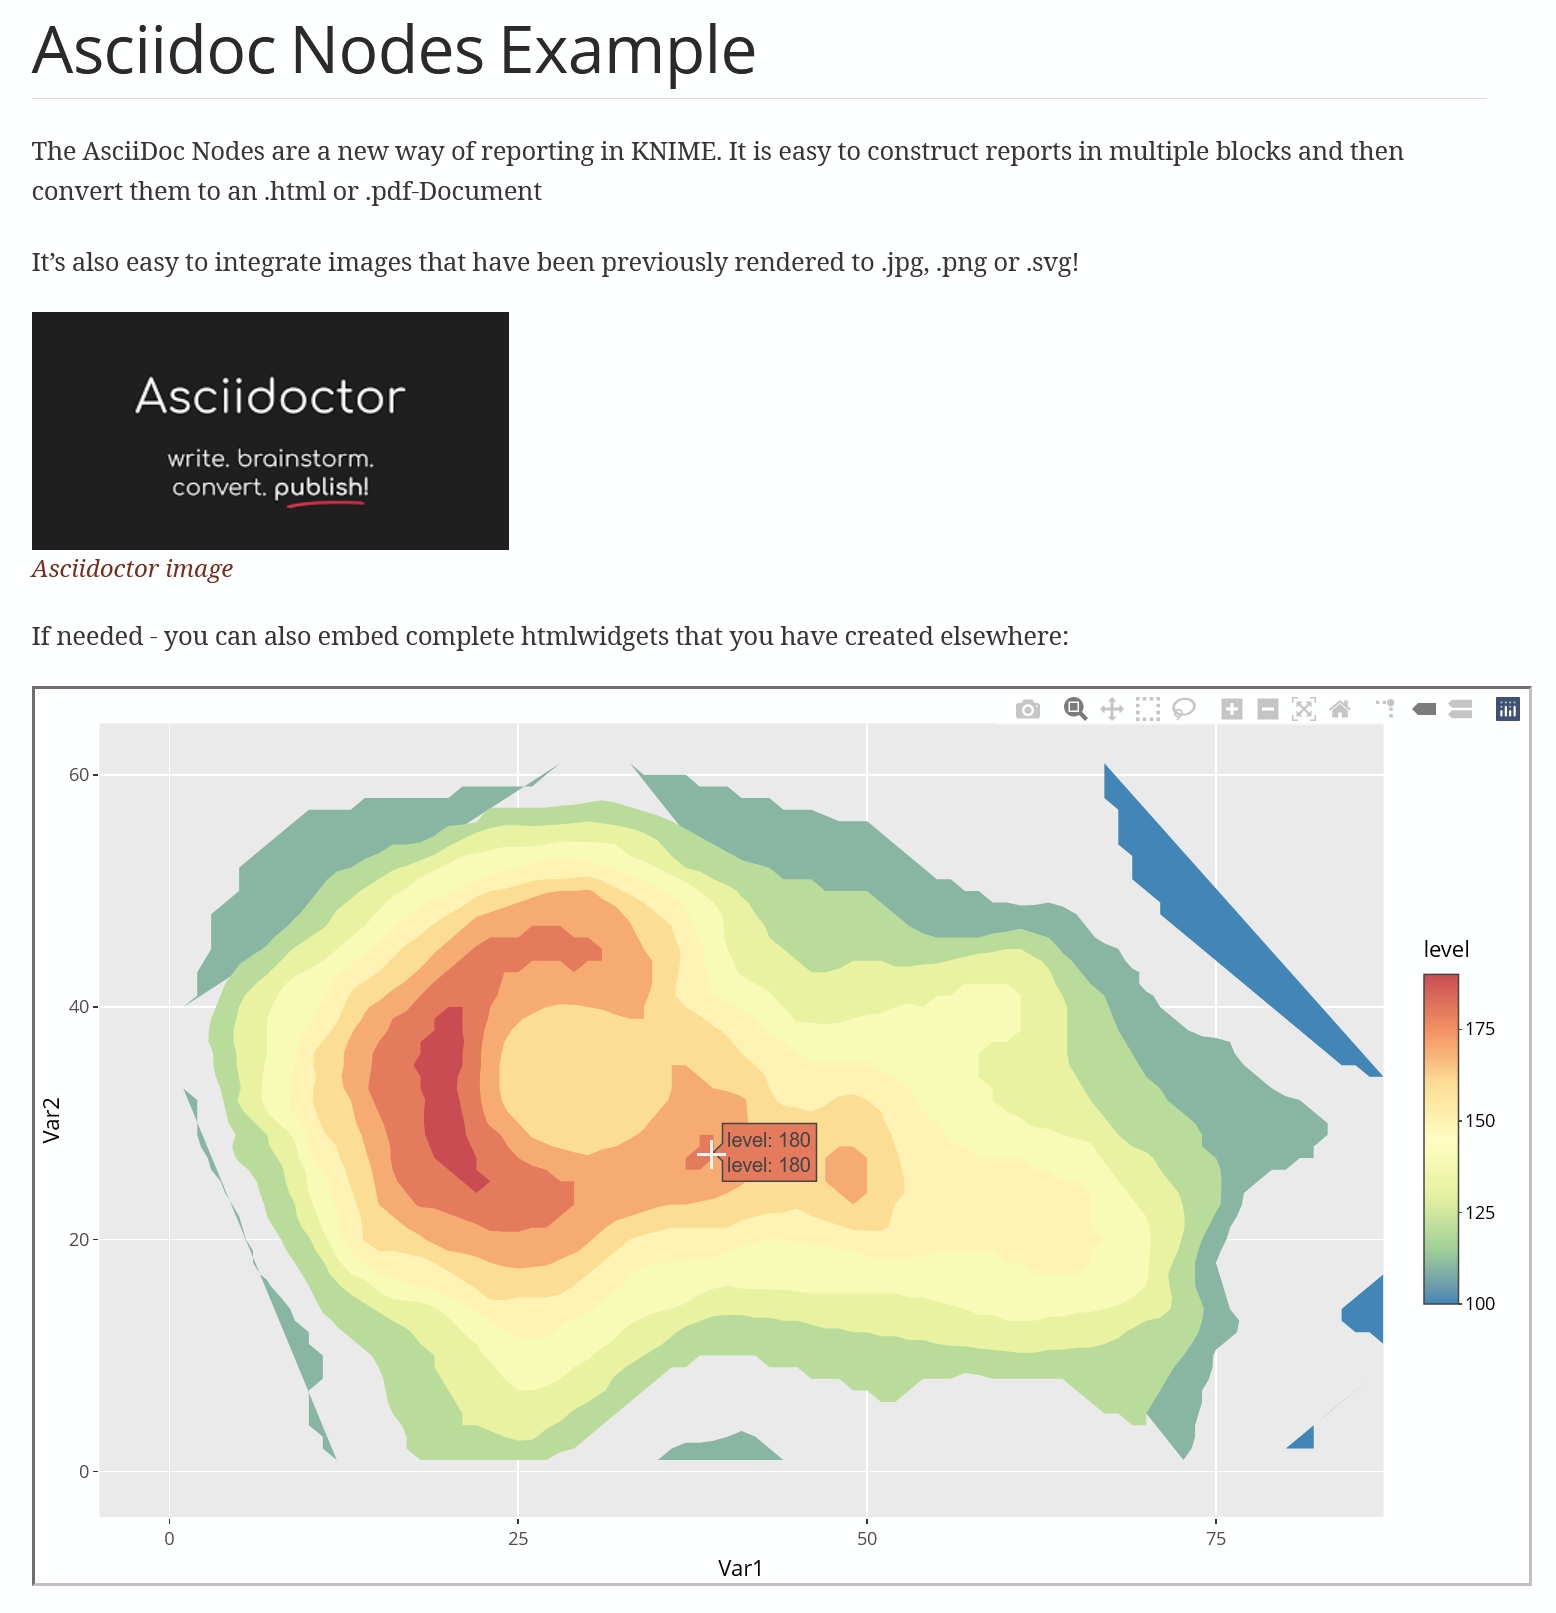
Just a quick update: I gave it a shot and tried to include a htmlwidget that I created in R with ggplot/plotly/(ggplotly) and htmlwidgets::saveWidget and that generally seems to work out ok:
Some edges remain to be polished and obviously sharing such a report involves sharing a folder or a zipped folder to include all the .js dependencies but that shouldn’t be too much hassle and would be required for including simple static images anyway as well.
I’ll try to compile a few example workflows as reference with the release of the nodes…
JavaSnippet creating the AsciiDoc part
String newLine = System.getProperty("line.separator");
return (
"If needed - you can also embed complete html widgets that you have created elsewhere:" + newLine + newLine
+ "++++" + newLine + newLine
+ "<iframe type=\"text/html\" src=\"p1.html\" width=\"1000\" height=\"600\">" + newLine
+ newLine + newLine
+ "++++" + newLine + newLine
);