Thanks for the heads up, @AnilKS! I can already tell that there are indeed different ways of interpreting Q1.
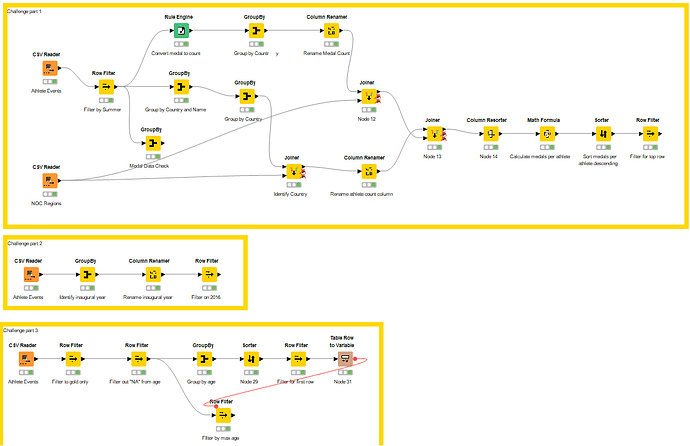
![]() Hi, folks! Here’s our solution to the Olympics Trivia challenge!
Hi, folks! Here’s our solution to the Olympics Trivia challenge! ![]()
![]() We noticed that Q1 can be interpreted in different ways, so depending on your reasoning you may get to a different answer.
We noticed that Q1 can be interpreted in different ways, so depending on your reasoning you may get to a different answer. ![]()
Thanks for all your submissions and see you tomorrow for a new challenge. This time, on one of the oldest beverages in the world: beer! ![]()
Indeed @alinebessa ![]()
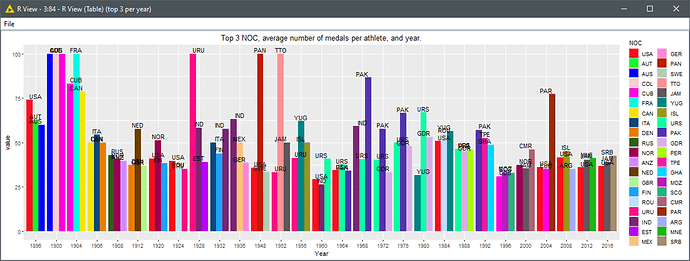
I did it by averaging of the single ‘average number of medals (gold, silver, and bronze combined) per athlete’ at a single $Games$. So the result is the average of the bars presented in this R chart.
The bar chart was excluded from the final submission, as I considered that it required some extra work to improve readability.
BR
Perfectly valid interpretation in our opinion!
This is my first time participating in the Just KNIME It challenge. I am not a data scientist, so there is likely a more elegant solution available. However, I was able to get to the answers the challenge presented.
Welcome to our community, @Patrick_Zewatsk! We hope you learn a lot about analytics and data science by tackling these weekly challenges and also checking other solutions here in the forum. <3
Hi @jhoney12, and welcome to our community!
There’s an explanation about what the codes mean here: Solutions to "Just KNIME It!" Challenge 11 - Season 3 - #16 by tomljh
We believe it’s fair to standardize the codes and use just one of them for both instances.
Cheers,
Aline
This topic was automatically closed 90 days after the last reply. New replies are no longer allowed.

