Hi Everyone ![]()
This week I have used example data from the curation process of chemical datasets to demonstrate the funnel plot:
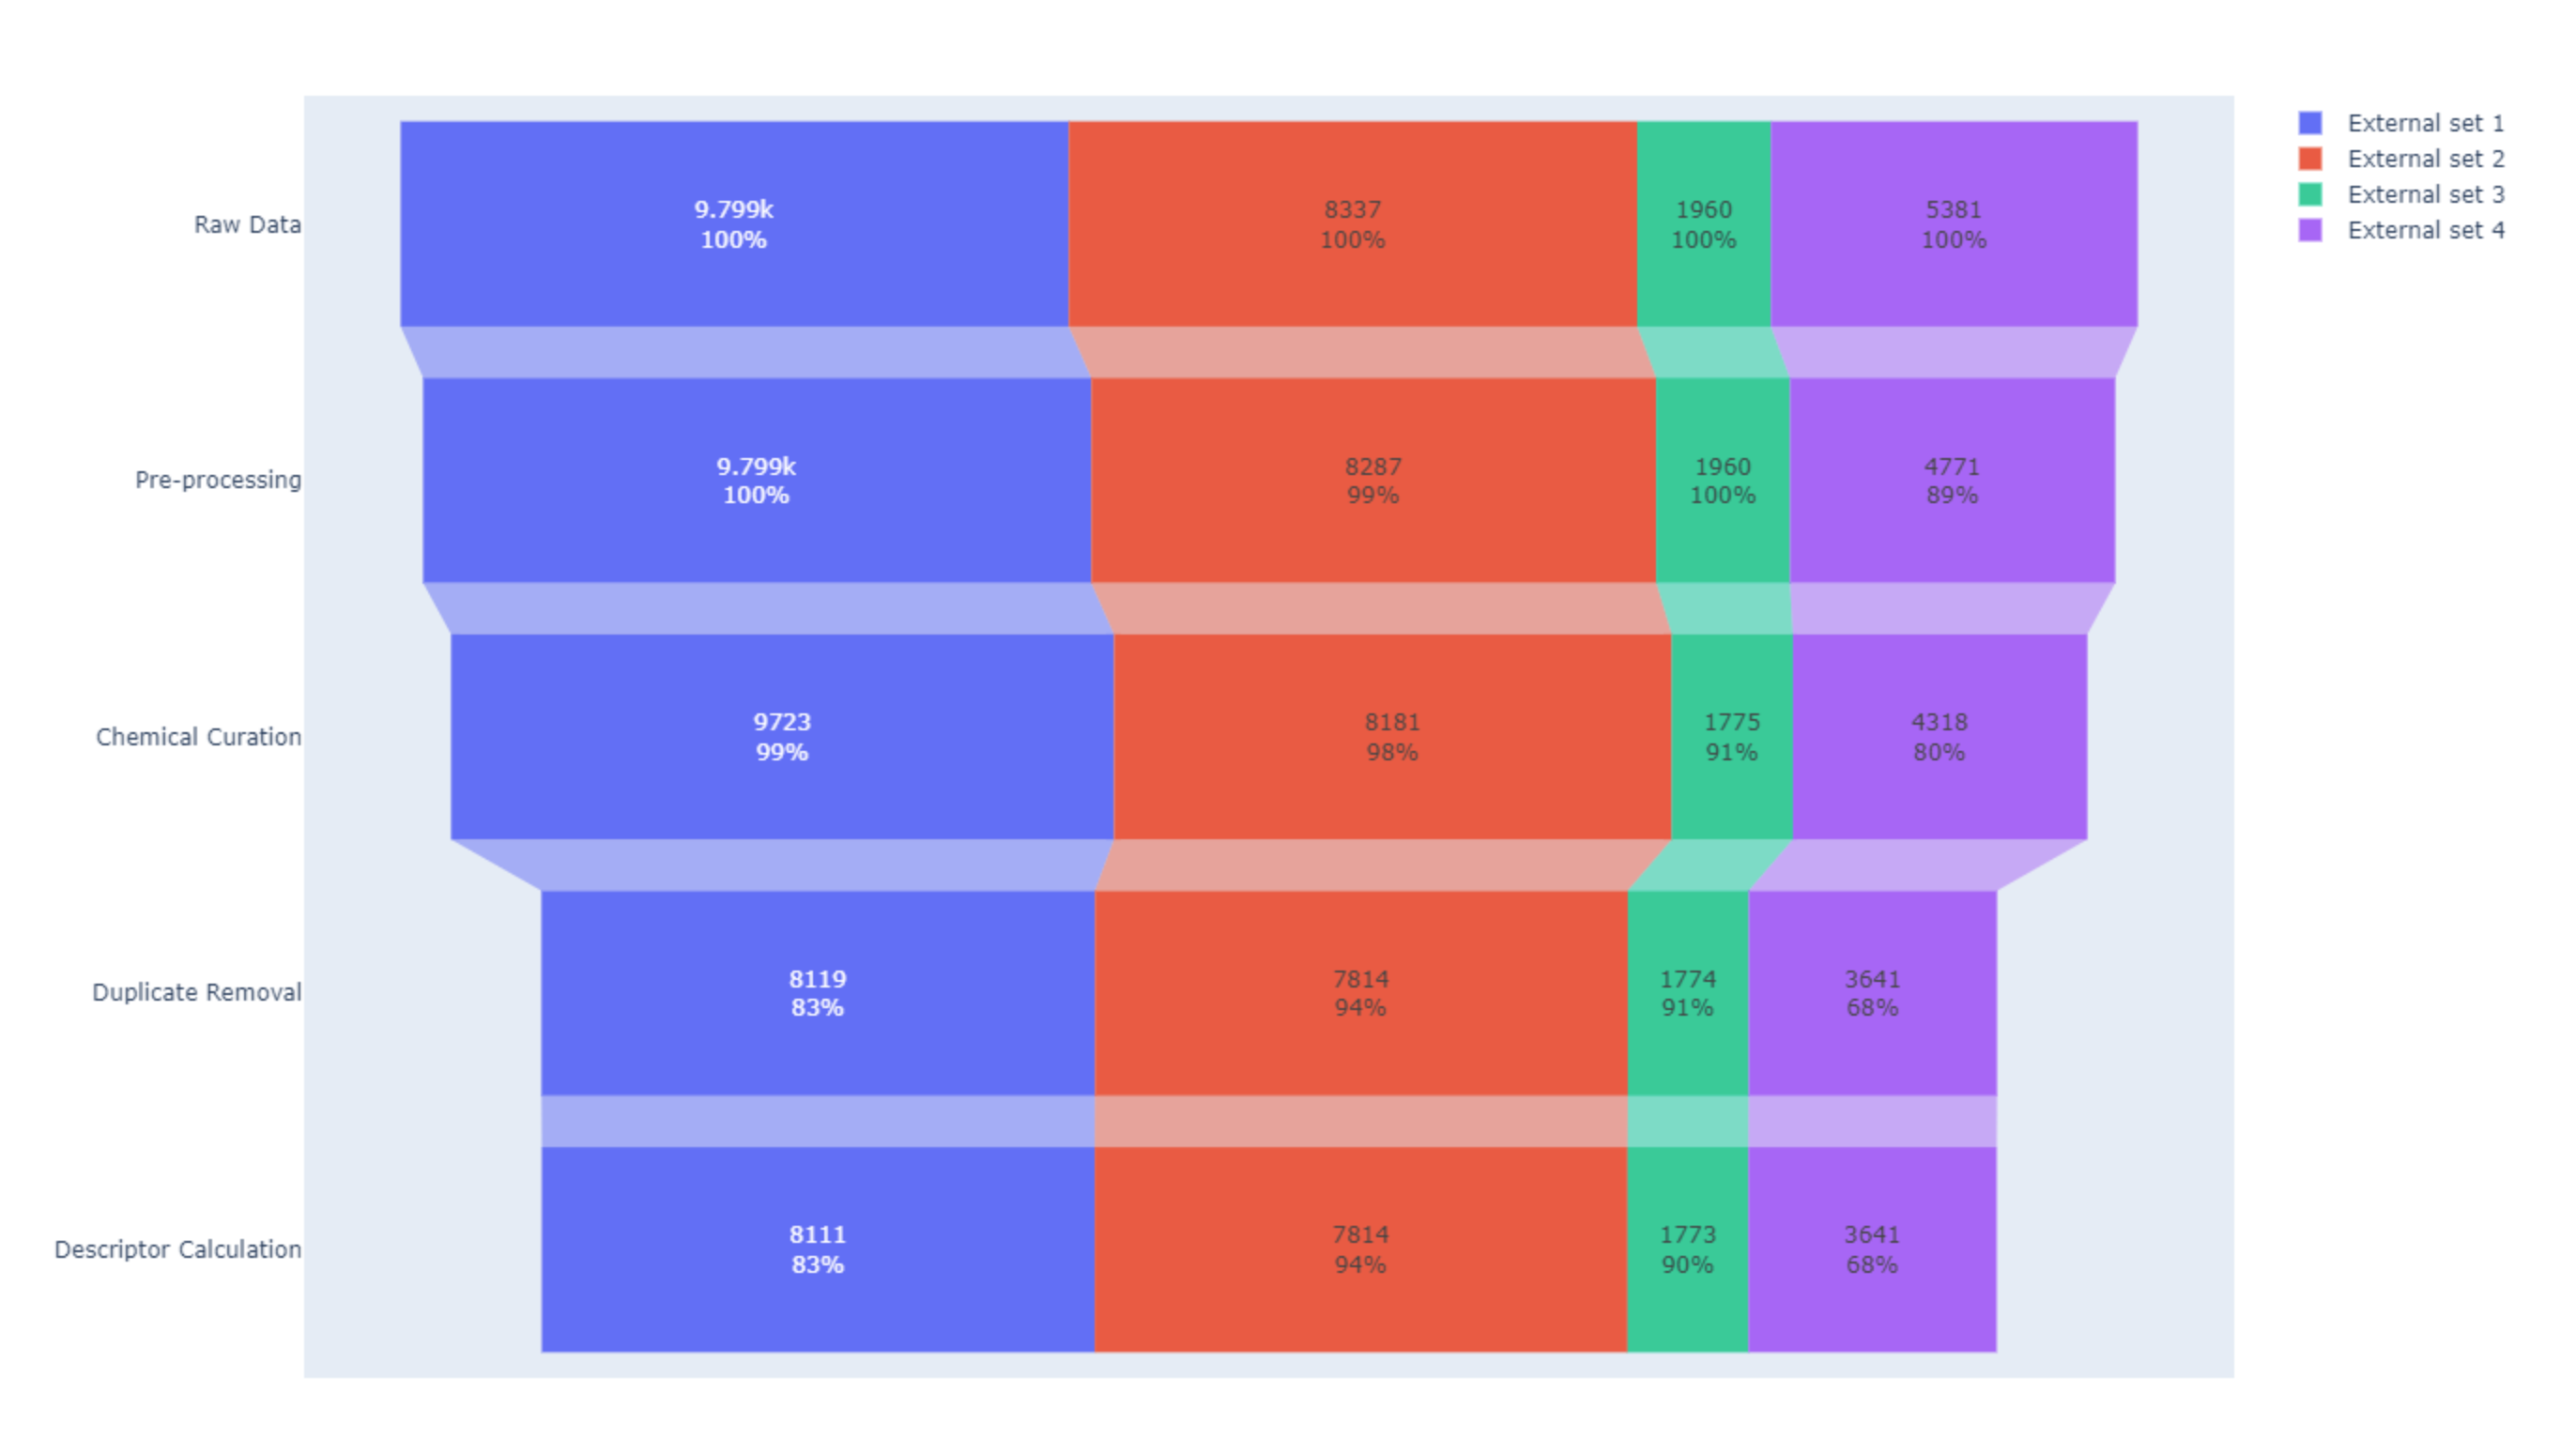
Over a series of curation steps, we lose molecules until we are left with clean, standardised chemical structures or descriptors to use in the next steps of our methodologies.
I have dealt with the data in two different orientations:
First:


Second:


Does anyone know why my value of 9799 is written as 9.799K when none of the other values are?
Here is my workflow on the hub:
Best wishes
Heather