Hi all, I’m facing the following problem:
I’m analyzing and grouping emails concerning their sentiment (positive, neutral or negative). No I want to visualize the sentiment classes using the gaussian curve. Therefore I’m using the following nodes: statistics, table to row and gaussian distributed assigner.
Statistics calculates mean, standard deviation and the table to row creates the flow values.
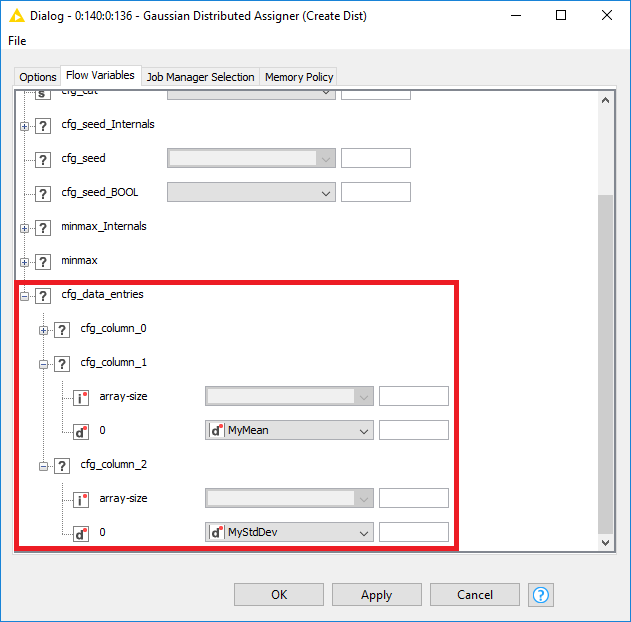
In the Gaussian Distributed Assigner I can see the Flow Variables but I don’t know how to assign them to Mean and Std.Dev below the Options Tab.
Is their an example or a mapping table?
Thanks for help,
Dieter
Hi @dgoebel -
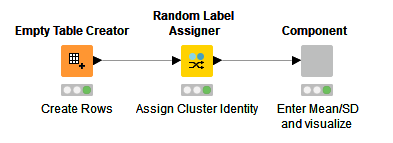
Here’s an example workflow that creates a Gaussian distribution based on a mean and standard deviation provided by the user in a component. You can double click on the component to set the parameters to whatever values you like.
GaussianDistributedAssignerExample.knwf (17.6 KB)
The parameters are passed via flow variables into to the Gaussian Distributed Assigner node like this:
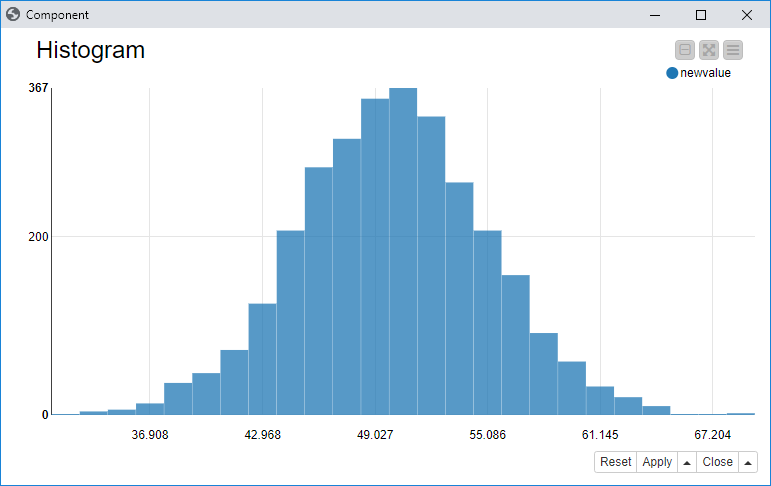
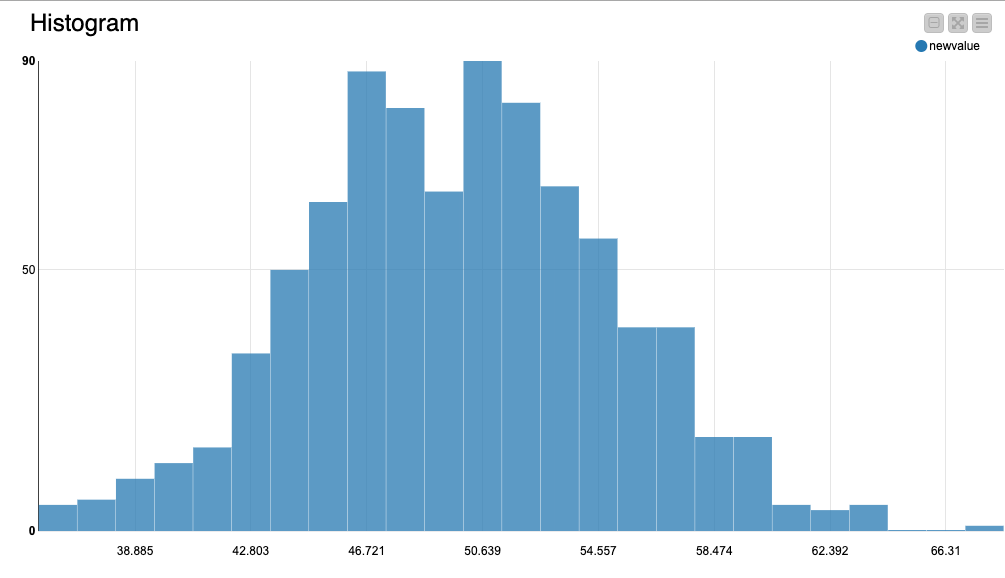
The Histogram node is used to visualize the distribution.
Hope this helps!
4 Likes
This topic was automatically closed 182 days after the last reply. New replies are no longer allowed.