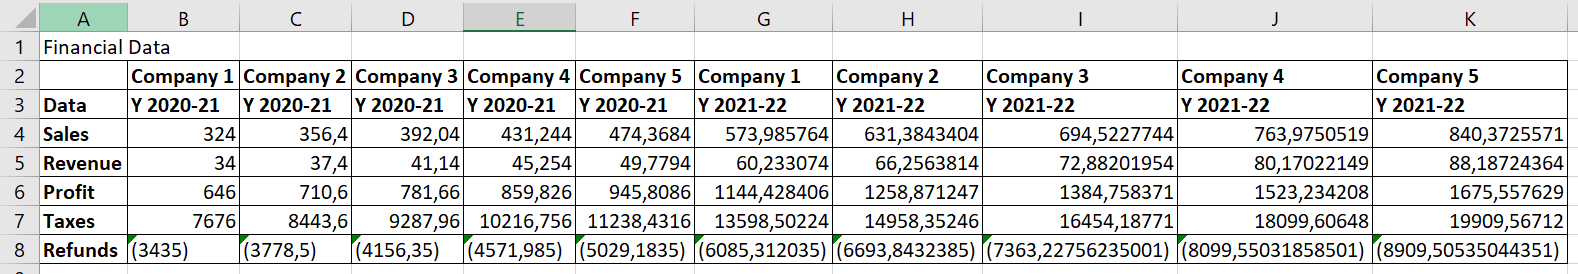
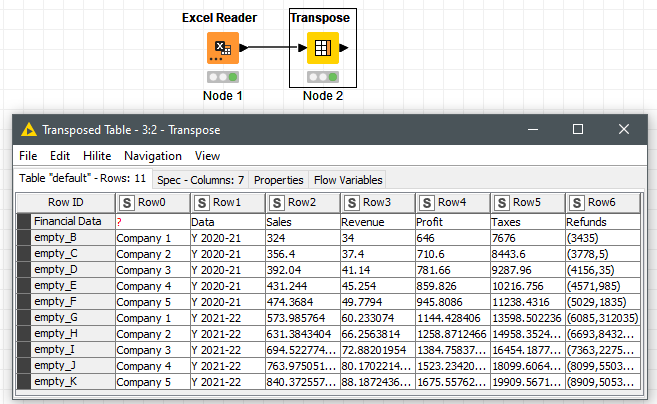
I’m currently struggling to prepare a dataset for visualization in Power BI. The dataset contains a negligible first row (1) and a double header (row 2 & 3). I’m trying to transform the data so that later I can create a line chart in Power BI that shows the development for all companies for all KPIs (column A) over time. The data currently looks like that:
Hi @Henan , can you show us what is the desired data output?. How should the data look like?
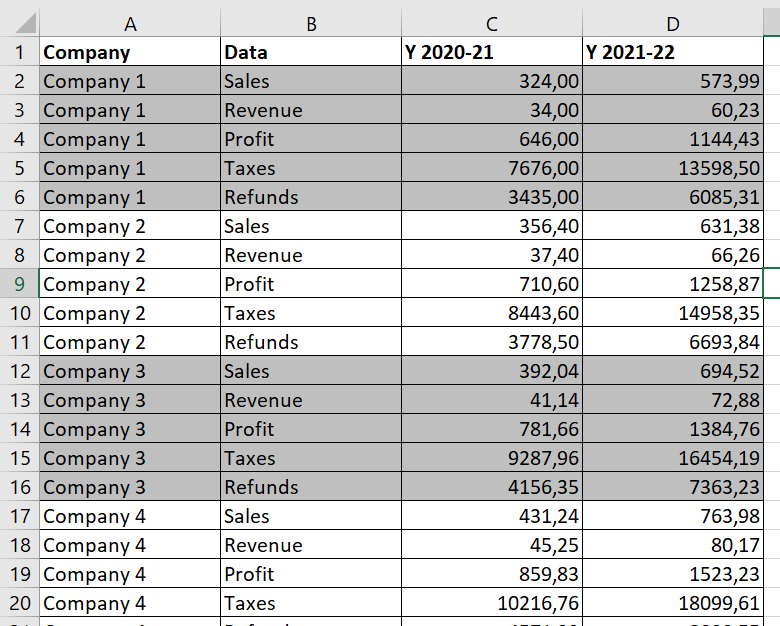
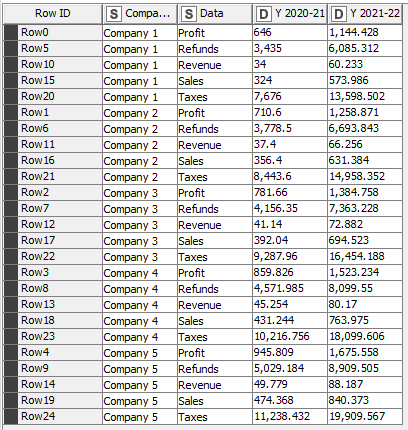
EDIT: Nevermind, I mistook your second screenshot as the results that Knime produced, but I understand that it’s actually what you want as results, is that correct?
How did you do this transformation in Excel? The steps can usually be reproduced in Knime
Hello @Henan
I haven’t tested yet with your data but, as all your source data formats are Double in all the columns but the first one. It can be very simple.
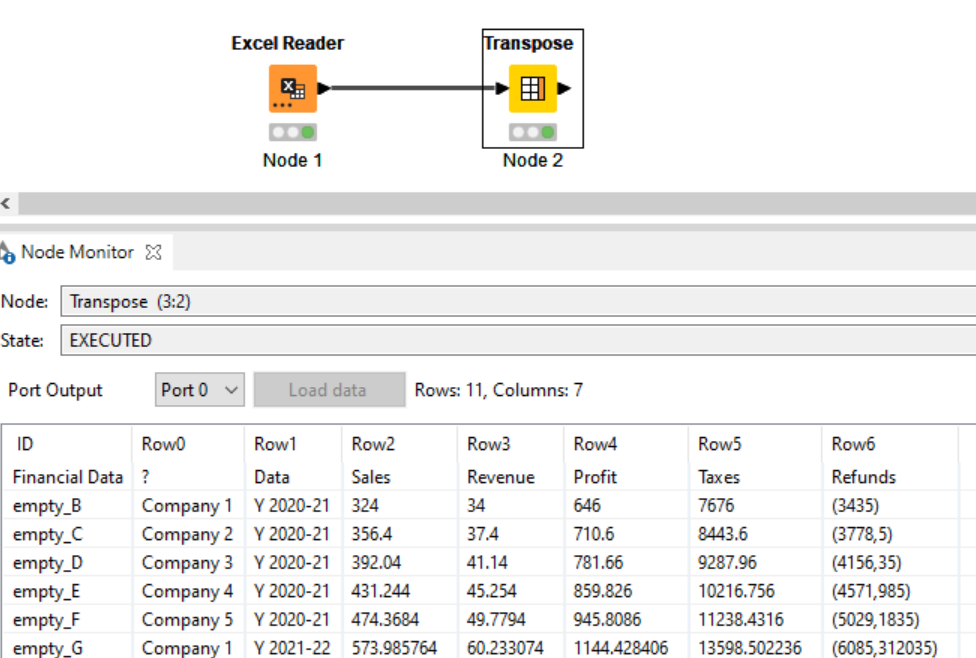
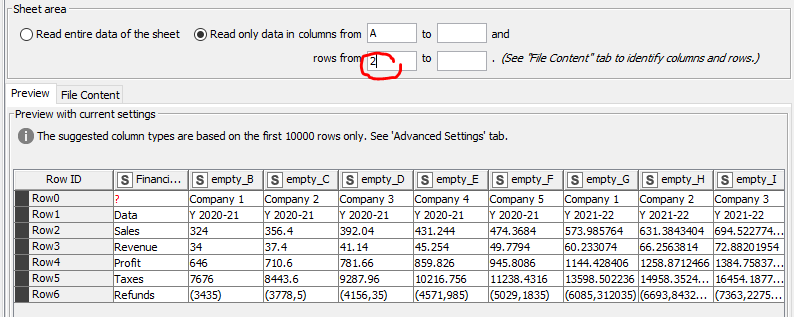
Read the data skipping the first row [ ‘Financial Data’ 1:1 ], and apply the ‘Transpose’ node; you only will need to insert column headers from the resulting first row afterwards.
BR
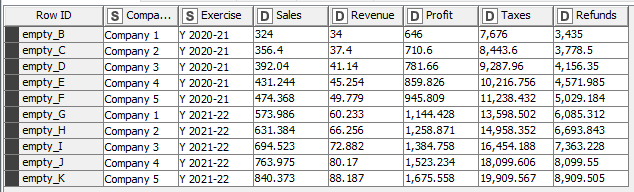
PS.- The resulting data configuration out from the Transpose, can be quite suitable to work out in PBI as well
Hi @bruno29a , you’re right, the 2nd picture shows the desired output. I just manually cut & pasted the data in Excel into the format shown in the screenshot. Unfortunately, I couldn’t replicate it in Knime
These are the basics but is not going to work because the custom format of your negatives. As we have to read them as string. Give me few minutes and i’ll deliver a functional workflow…
@Henan
The main problem looking at your excel (thing that I usually try to avoid ) is that; when I saw the picure first, I though all the data was numeric but the Example file provided is cheating us. As in the ‘Refunds’ row there aren’t numbers in the source; they are typed in text format with parenthesis.
However in the second tab “Transformation Idea”, ‘Refunds’ is numeric and positive (?)
And also but not less important, your file has been saved from a system settled with Spanish formatting for numbers, then Refunds’ strings consequently are typed with comma
I was wrong because in one of the rows (Refunds) the values are strings, and I won’t modify your source.
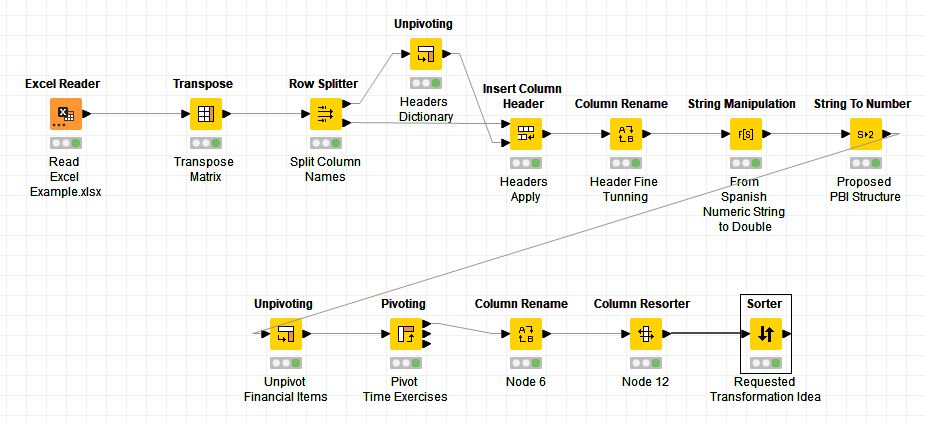
This is the workflow, and as you see, the quality of the data can force you to complex transformations.