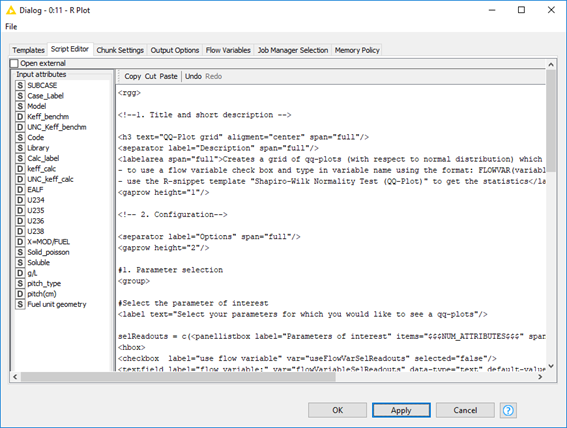
I am working with “QQ-plot grid” installed in the R-server. But, it does not work, the template is not shown when I click “Apply” to run the template.
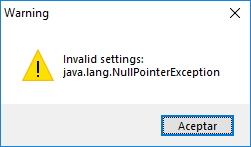
I have got this message “WARN R Plot 0:11 failed to apply settings: java.lang.NullPointerException”
I am working with Windows10. In Prefereces/R-scripting, Rserve is as “localhost”, and I have R located at “C:/Program Files/R/R-3.5.1/bin/x64/Rgui.exe”.
could you please provide me with your script (maybe even your workflow) and the version numbers of your R, R-serve and any other involved library that you are using?
R.version _
platform x86_64-w64-mingw32
arch x86_64
os mingw32
system x86_64, mingw32
status
major 3
minor 5.1
year 2018
month 07
day 02
svn rev 74947
language R
version.string R version 3.5.1 (2018-07-02)
nickname Feather Spray
======================================
packageVersion(“Rserve”)
[1] ‘1.7.3’
======================================
Knime version:KNIME 3.6.1
======================================
S.O. Windows10
======================================
Just to make sure we are on the same page.
What you did is add a R plot node to your workspace and then you selected from the templates screening/qc/QQ-Plot grid and then hit the Apply-Button? At least this way I was able to reproduce your problem.
The thing is that this is a problem of the scription-extension (that’s why I moved the post here) and not possible to get rid of without any code changes. However, there seems to be a work around.
Add a R plot node to your workspace
Select a random template, e.g., basic/cdf/Cumulative Density Function
In the Script Editor select unlink from template
Go to the templates tab and select screening/qc/QQ-Plot grid
Thanks a lot for your time. Unfortunately, it does not work,
I have tried your procedure, but the plot I get is only the “Cumulative Density Function”.
I have seen the same problem with:/R Snippet/distributions/Shapiro-Wilk Normality Test (QQ-Plot)