Explore statistics and relationships in data with the Data Explorer, Scatter Plot, and Table View nodes. Build an interactive view with a scatter plot and an interactive table.
For this solution. When I read my table in the hours per week column data is in bins. This means I cannot get a correct scatter plot? What are the recommendations for getting around this?
In the adult_w_commute.table file there are two similar fields: hours-per-week and hours-per-week [Binned]. If you just choose the former instead of the latter for your scatter plot it should work OK.
Hi @ScottF ScottF,
It is not like that. At least I haven’t that table in L1-DS, also there isn’t any commute time on that.
I have only one table : adult_women.table .
Dear @marvin_kickuth
Thanks again,
I would like to ask you a question, maybe you have answer for that.
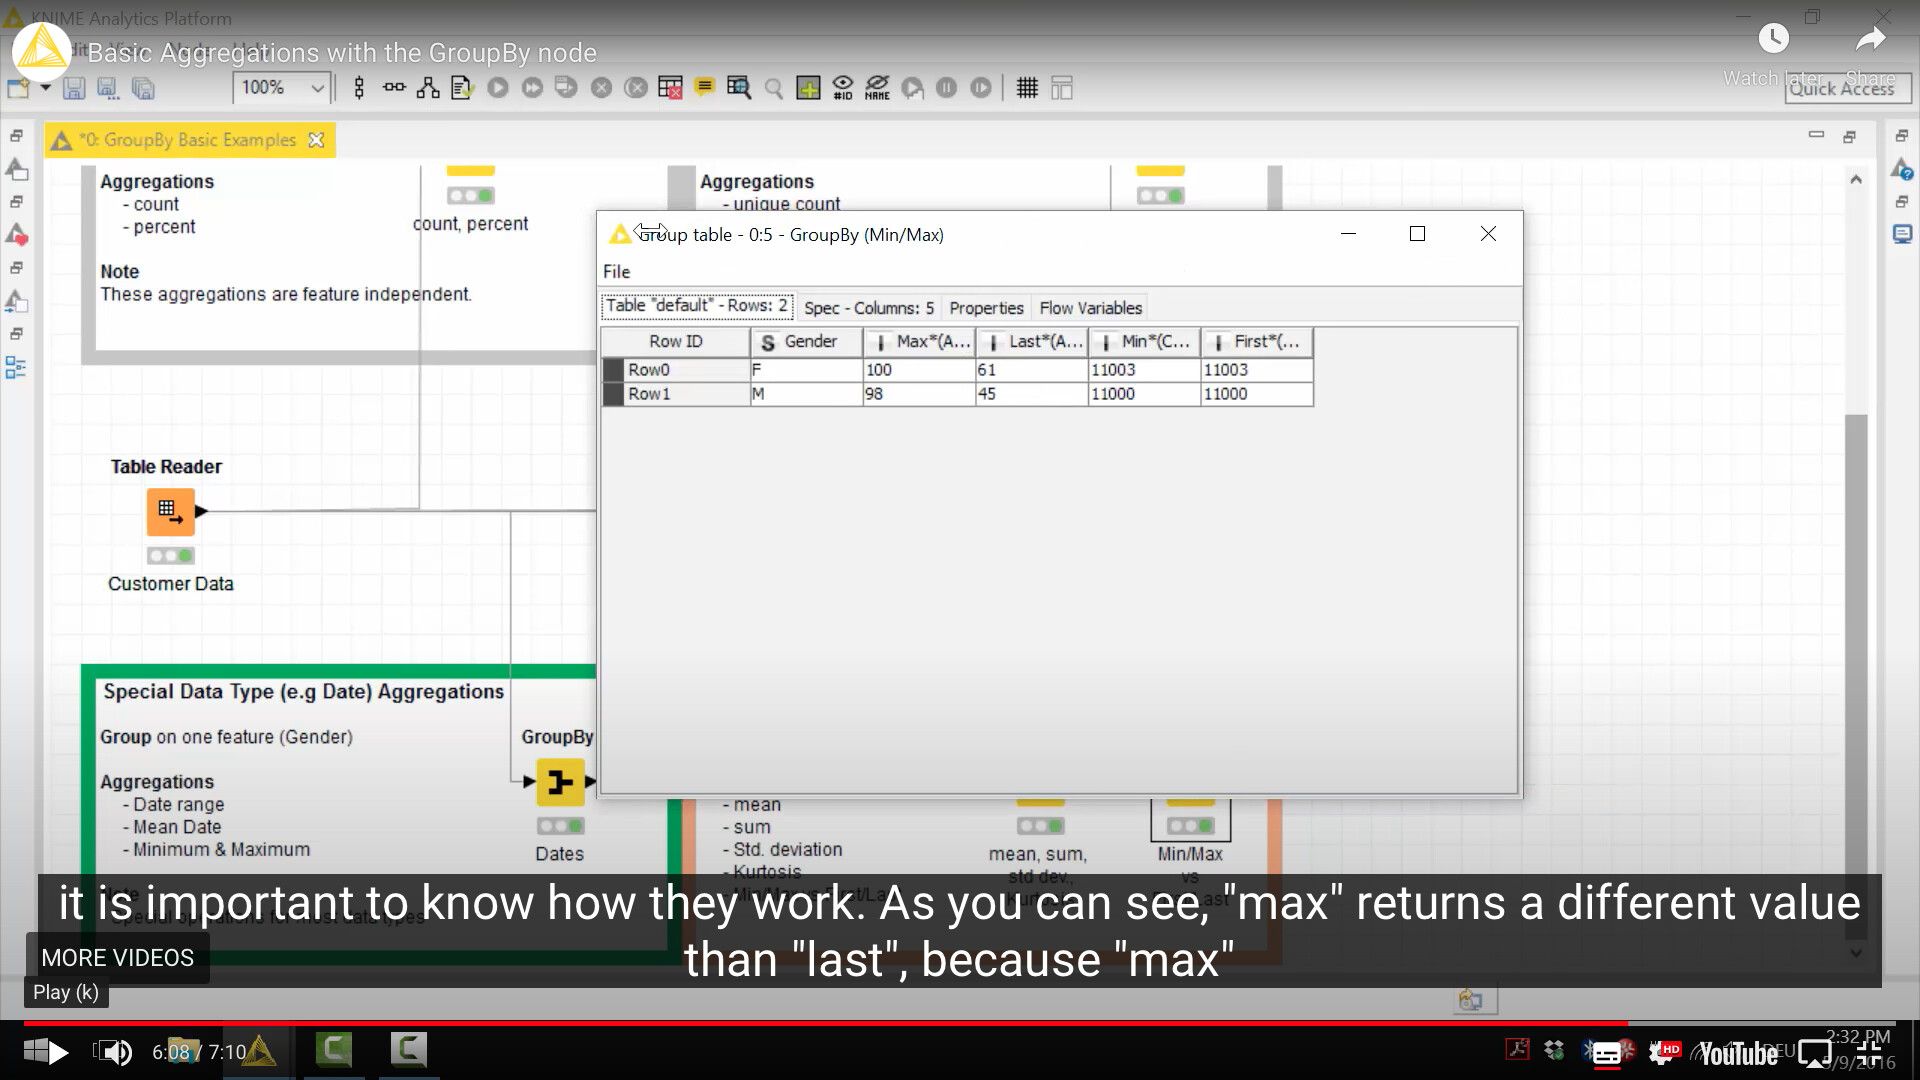
In all tutorials video and also Knime Doc, the output of all node looks like a Excell table, but in real world () at least my KNIME is not like that! Maybe you know why?
Thanks again.
I’m not quite sure what you mean. Did you execute the node you want to look at (shortcut F7) and then display its output table (right-click and then see the bottom table)?
Dear @marvin_kickuth
NO, It is not what I mean, After execute the node, and for example as you mentioned in this figure, Filtered table, KNIME show you result but in KNIME tutorial and KNIME Doc, the face of that result is different. As I wrote before, they looks like excell sheet but in reality it is not like that!
Maybe I could take photo of that , then it will be more clear!
thanks for your reply.
I’m very sorry for the late reply. I have looked into this, but wasn’t able to reproduce the issue. I hope this visual bug doesn’t bother you too much for now. I guess it is only a minor hickup…
I was trying out the Visualization exercise. After doing the selection on data points with <25h work hours and >120min commute, I see a new Selection column in the table that has a few “true” values. When I connect this node to the Table View node, the data table does show the Selected (Scatter Plot) column, but clicking the “show only selected rows” outputs no rows. This makes me think the interactive table doesn’t know which rows are selected?
In the configuration of the Table View, I did specify the Selection column name to be "Selected (Scatter Plot), but I still don’t get any output rows after selecting “show only selected rows”.


 ) at least my KNIME is not like that! Maybe you know why?