(1) Sorting Date y-axis in a bar chart (2) group a bar chart and a pie chart in one page

Hello,

i have two questions.

(1) Sorting Date y-axis in a bar chart
How do I get the date axis sorted correctly?

From 29.01.2021 up to 26.02.2021?

(2) group a bar chart and a pie chart in one page
I want to group a bar chart and a pie chart in one html-page

current state

Thank you in advance

greetings

1 Like

(2) group a bar chart and a pie chart in one page

Is it possible via the Visual layout editor

Hello @USCHUKN1ME,

(1) can’t do it within node so you need a workaround
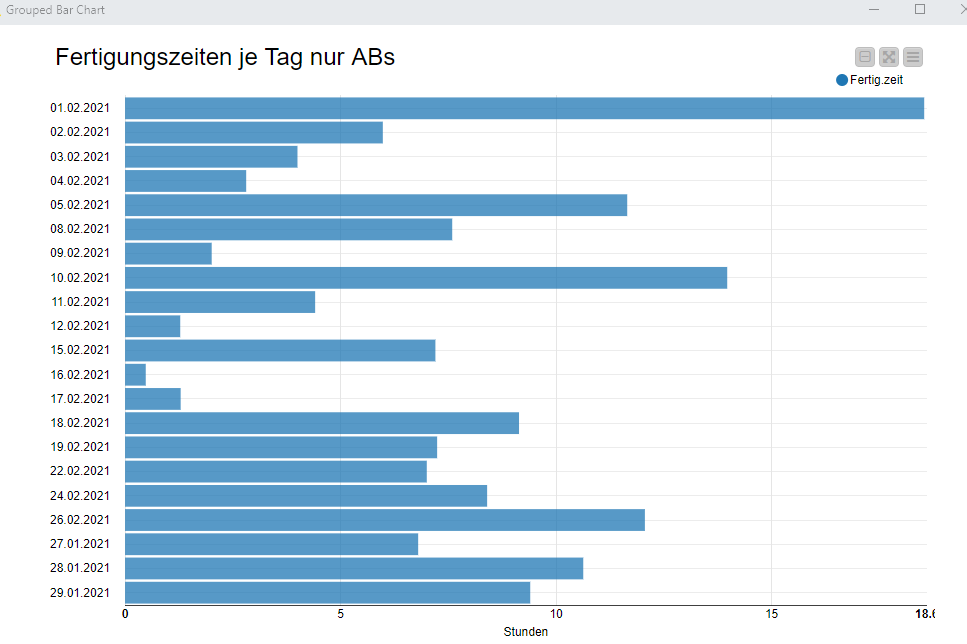
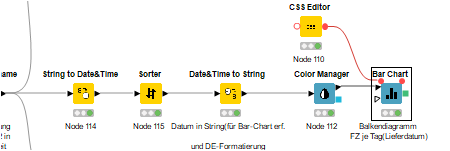
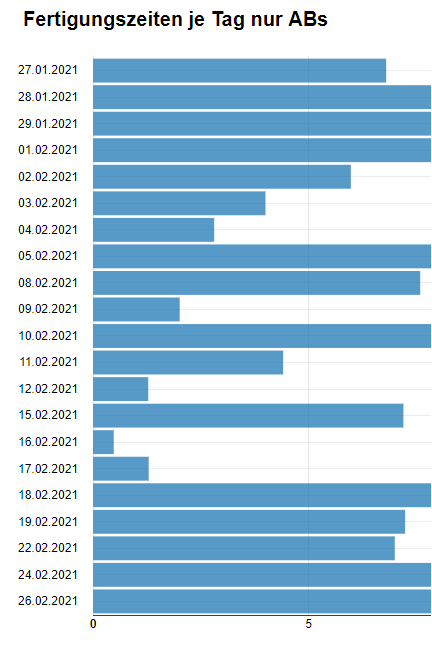
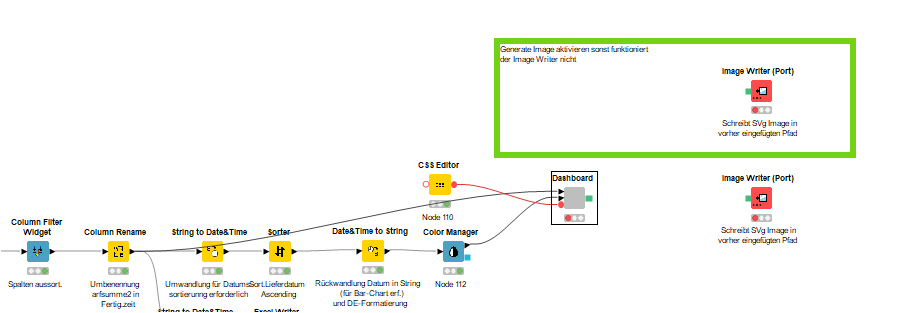
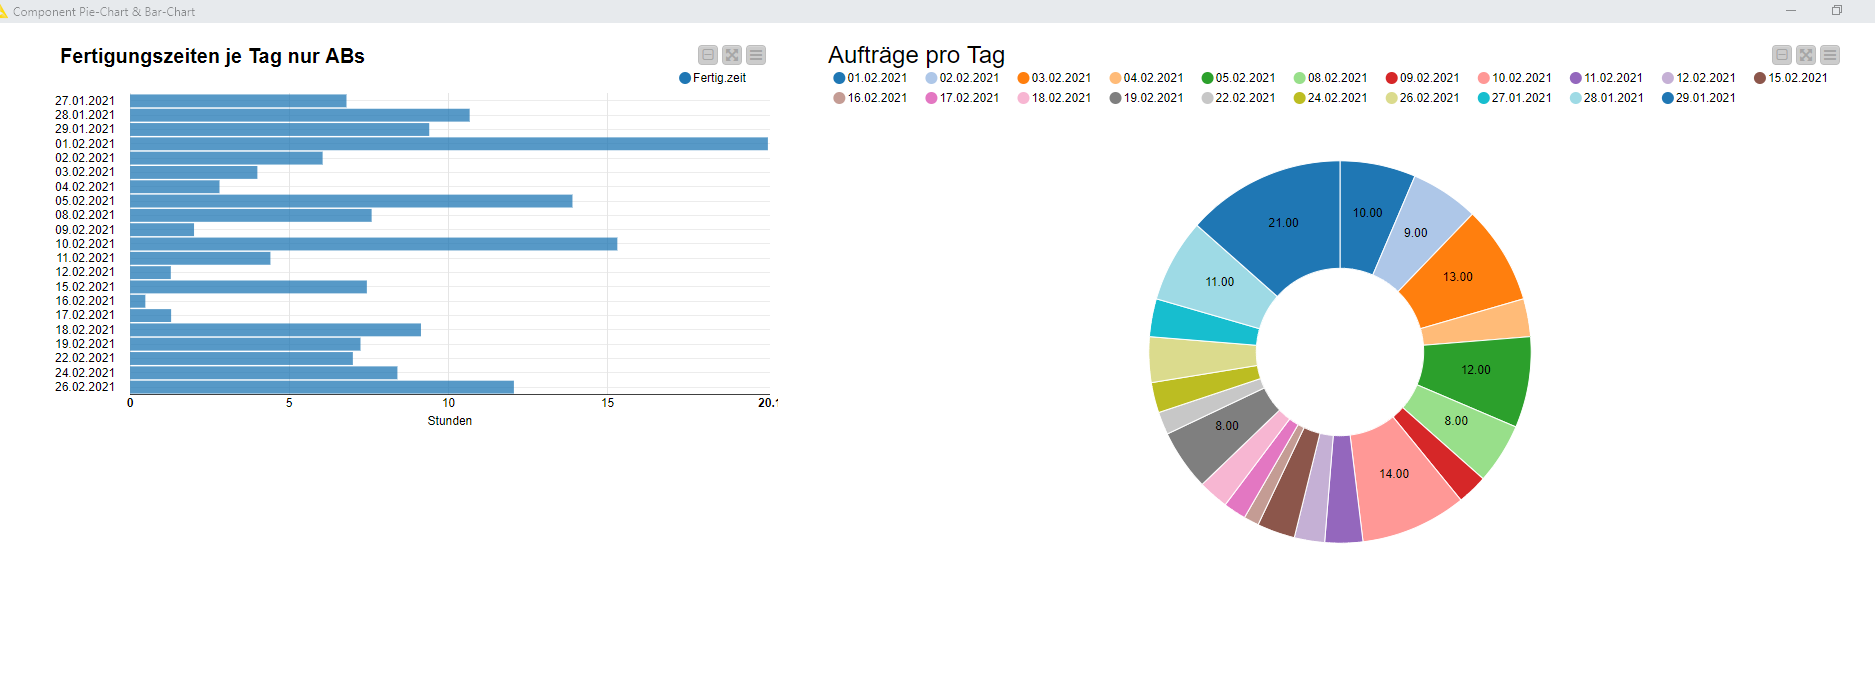
convert your dates to Date&Time Format using String to Date&Time node, then sort it ascending using Sorter and then follow it up with Date&Time to String node as Date&Time format can’t be category column in Bar Chart node.

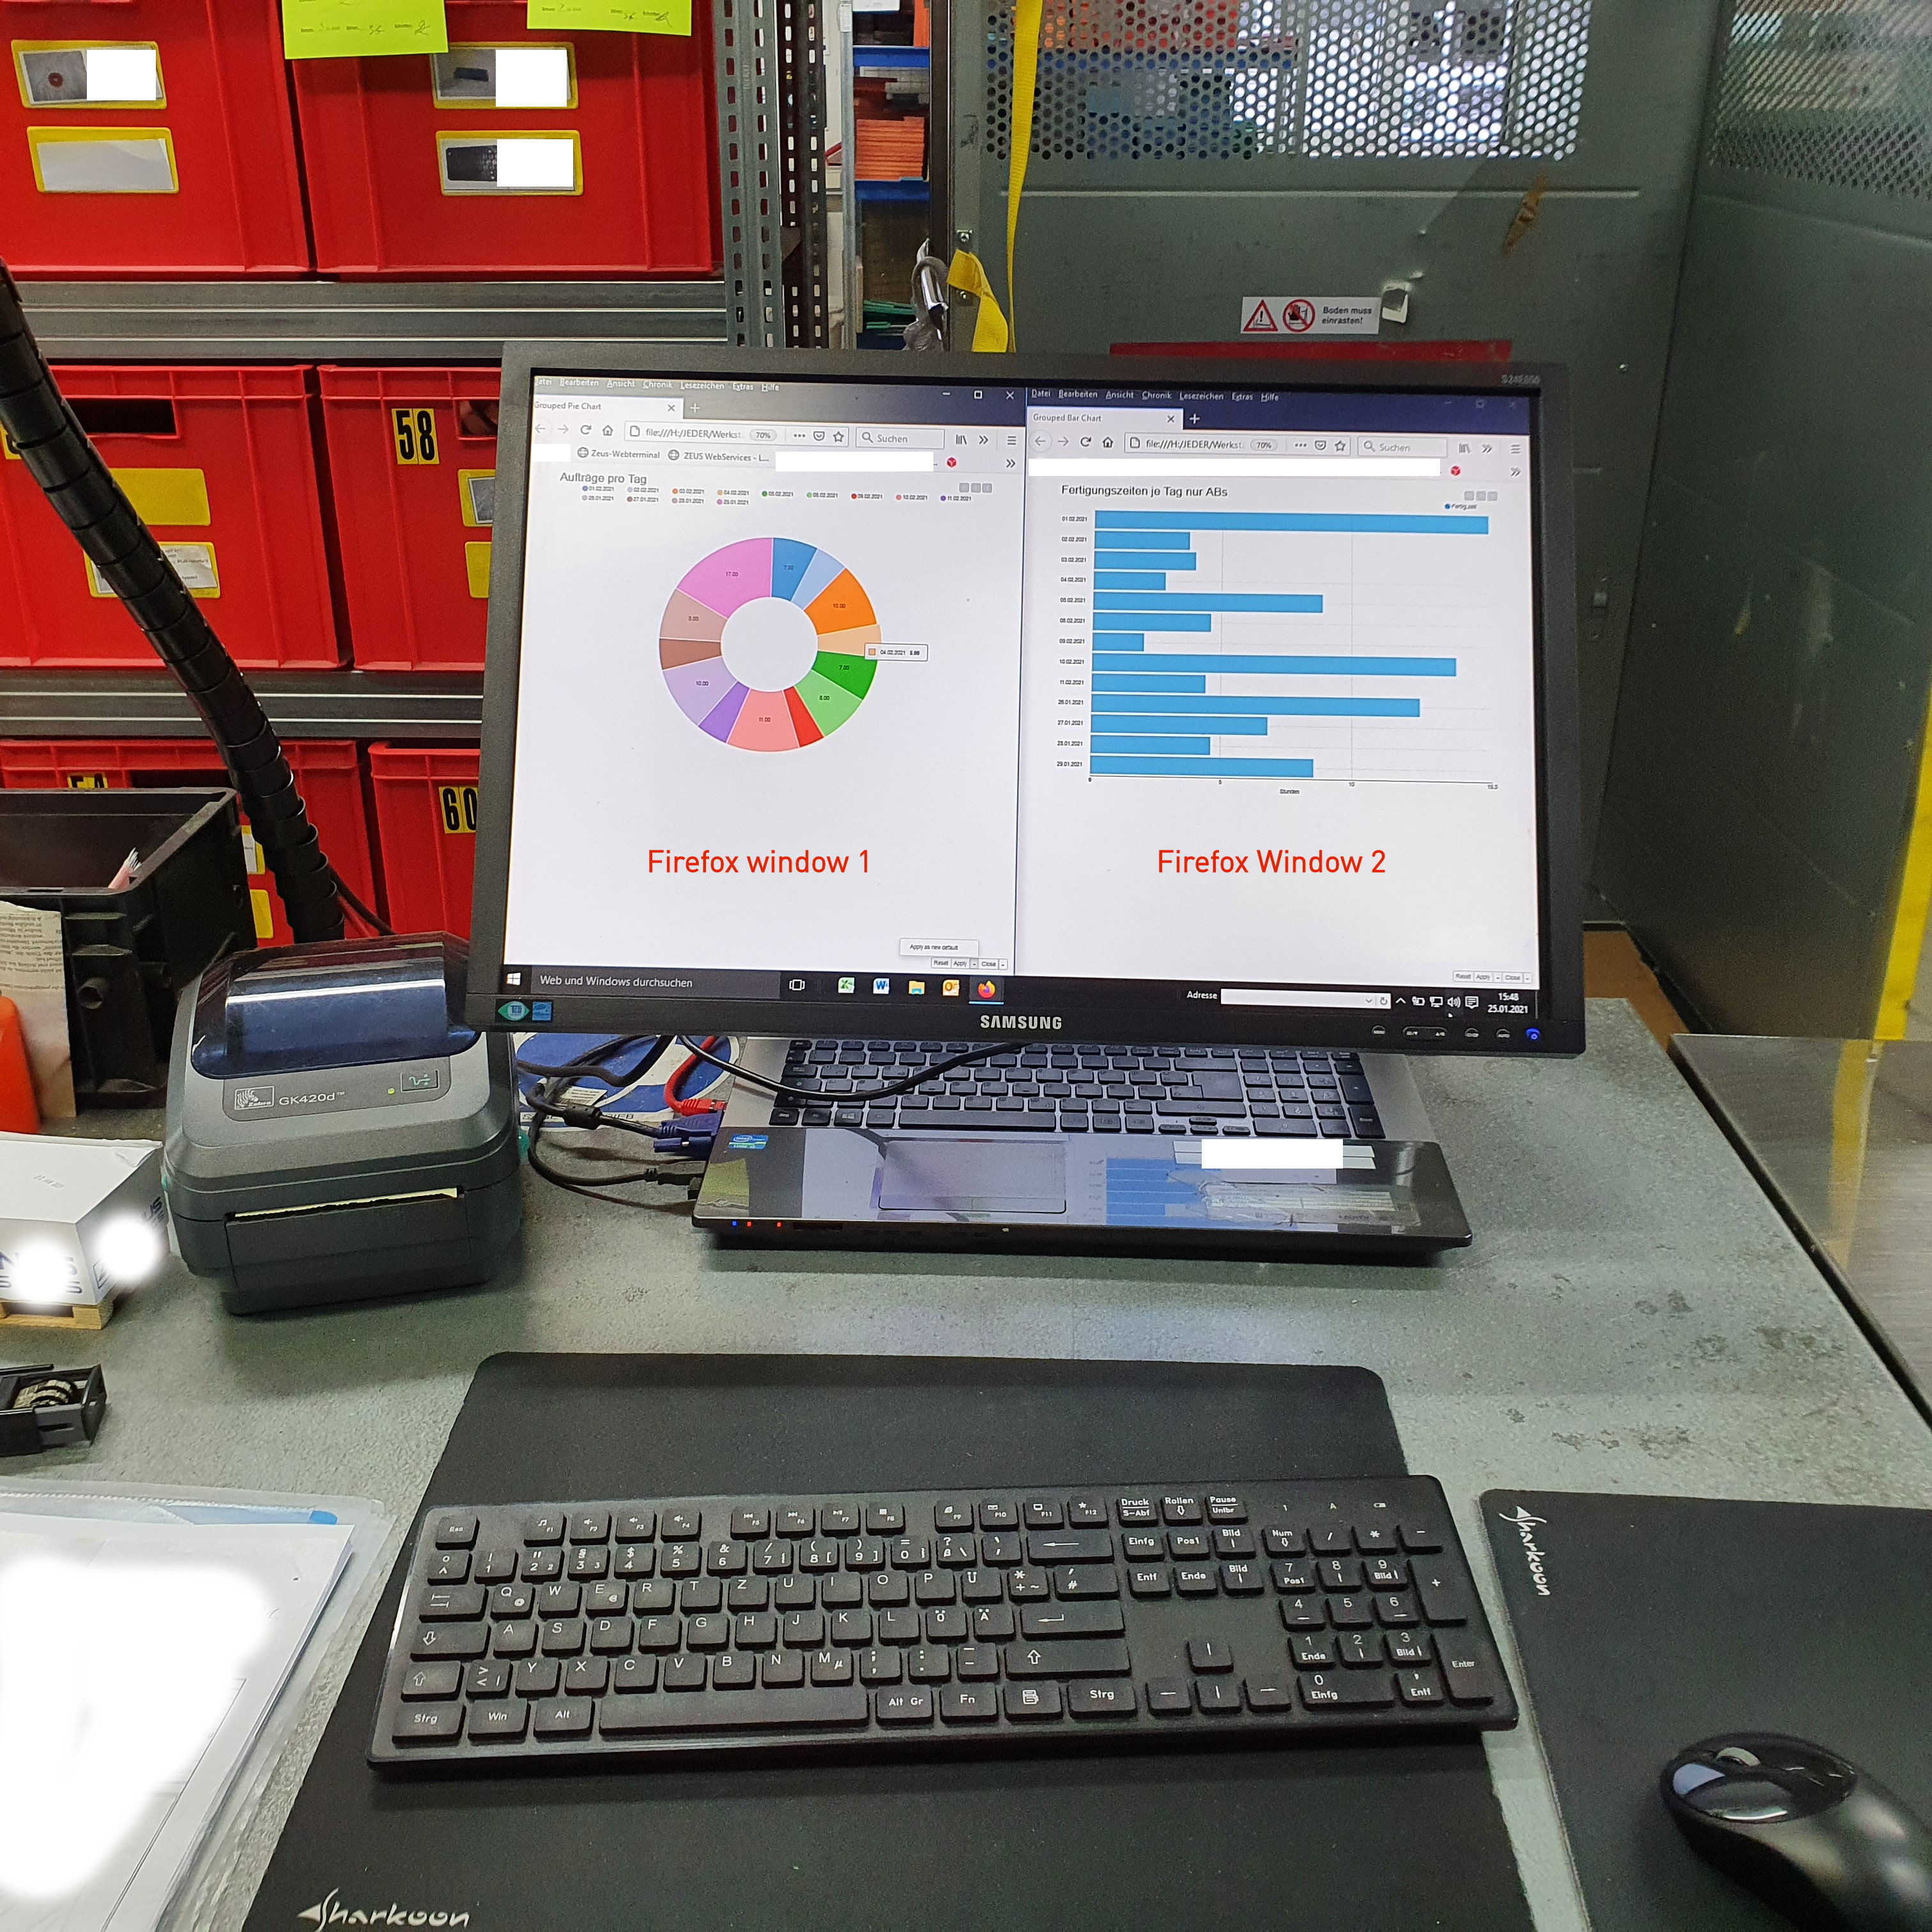
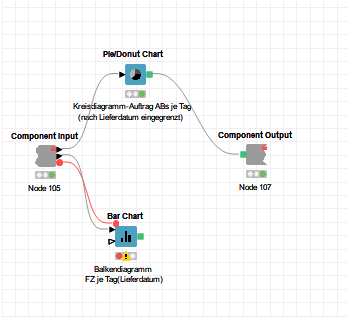
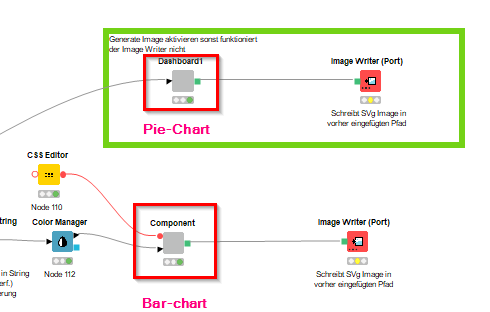
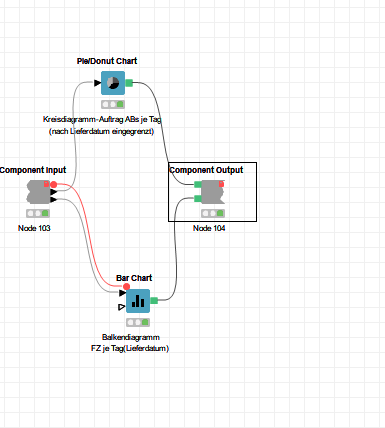
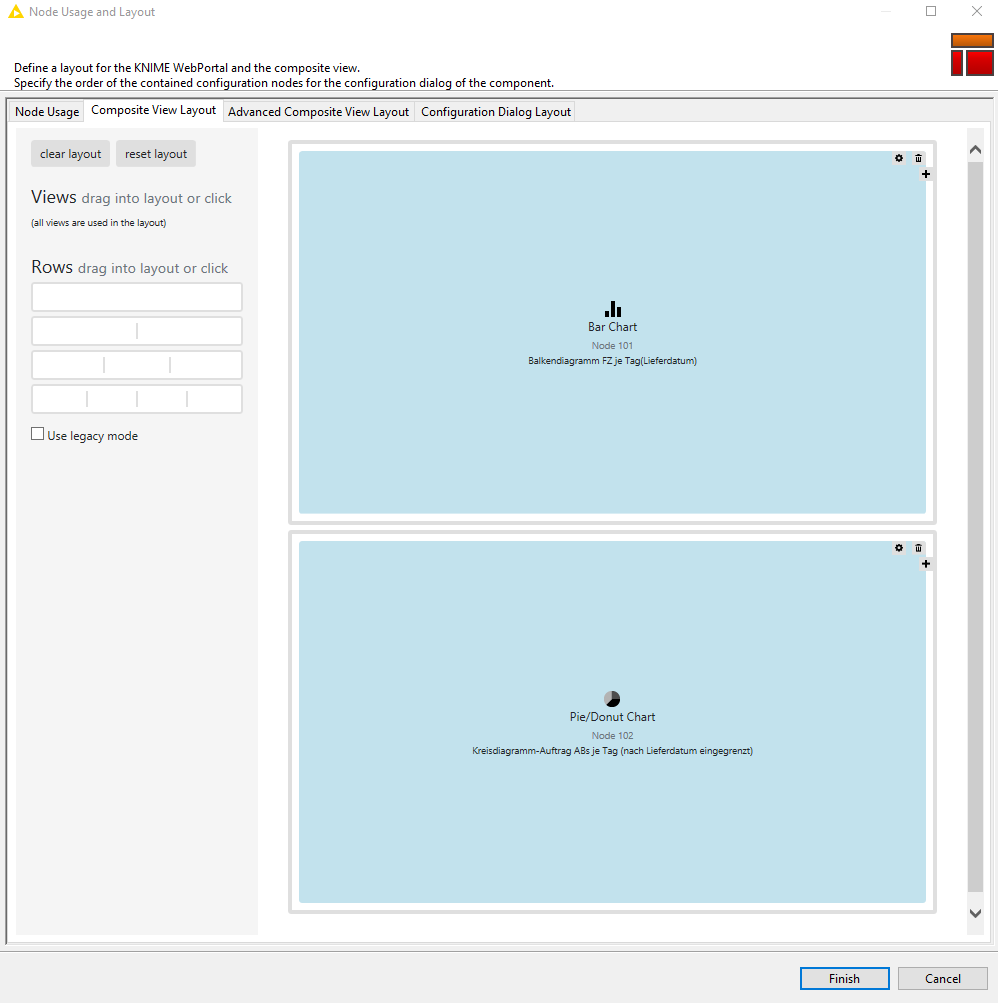
(2) Create Component with both Pie Chart and Bar Chart in it
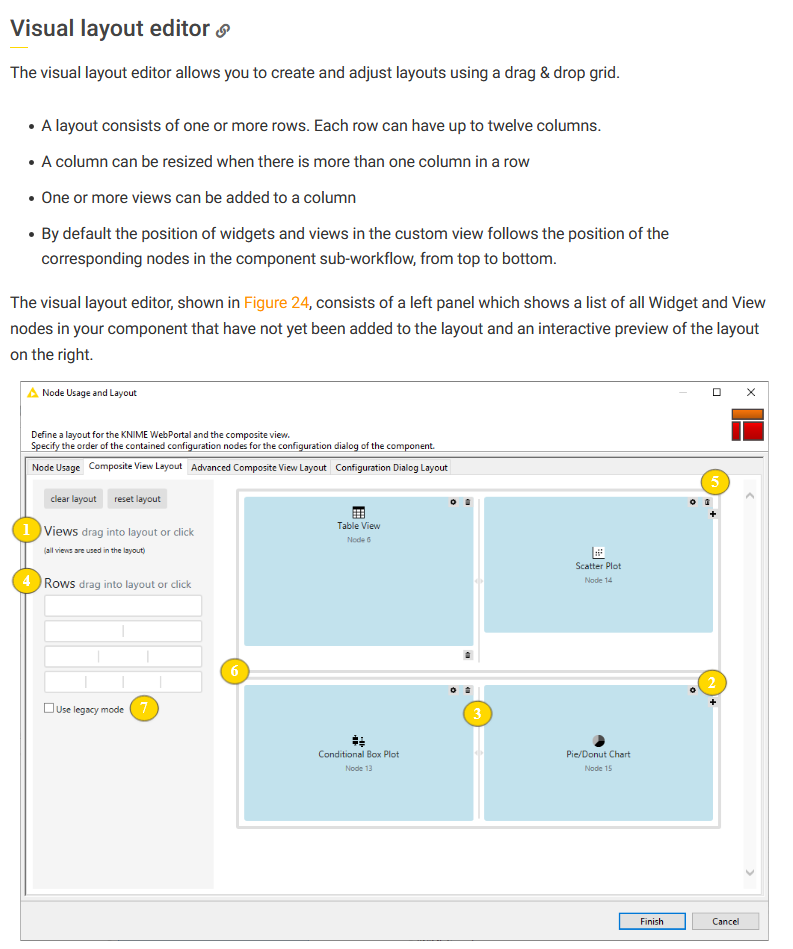
Components are KNIME nodes that you create which bundle functionality, have their own configuration dialog and their own composite views. Visual layout editor allows you to adjust Component’s view. Additionally here is link to the guide which seems you already found:

https://docs.knime.com/latest/analytics_platform_components_guide/index.html

Hope this helps!

Br,
Ivan

1 Like

Hello ipazin,

It answered my question # 1 - thank you very much.
Sortierung Lieferdatum aufstiegend nach Datum fĂĽr Bar Chart Node

Now i will try your solution for my question #h2o

Greetings

Hi again ipazin,

solution for my question #2 is very hard for me :expressionless:

Workflow

Component open
Component-open

Unbenannt

I don’t know what exactly to do here.
:thinking:

I created a separate compente for each node (pie chart and bar chart).
Each component works ( get the charts)

Component-getrennt fĂĽr PIe und BAR Chart

What is the next Step ?

Greetings

Do these two components have to be combined in one component now - see below. Example:

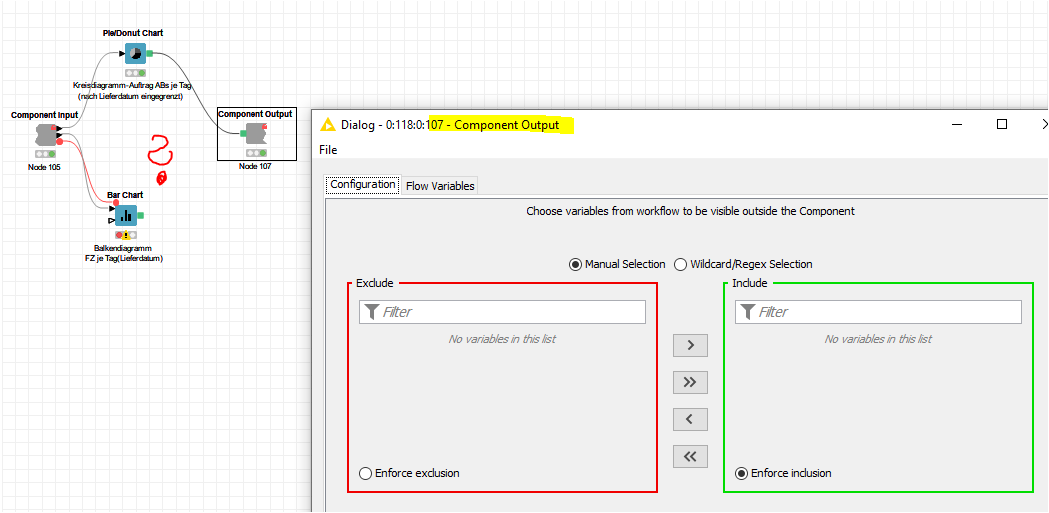
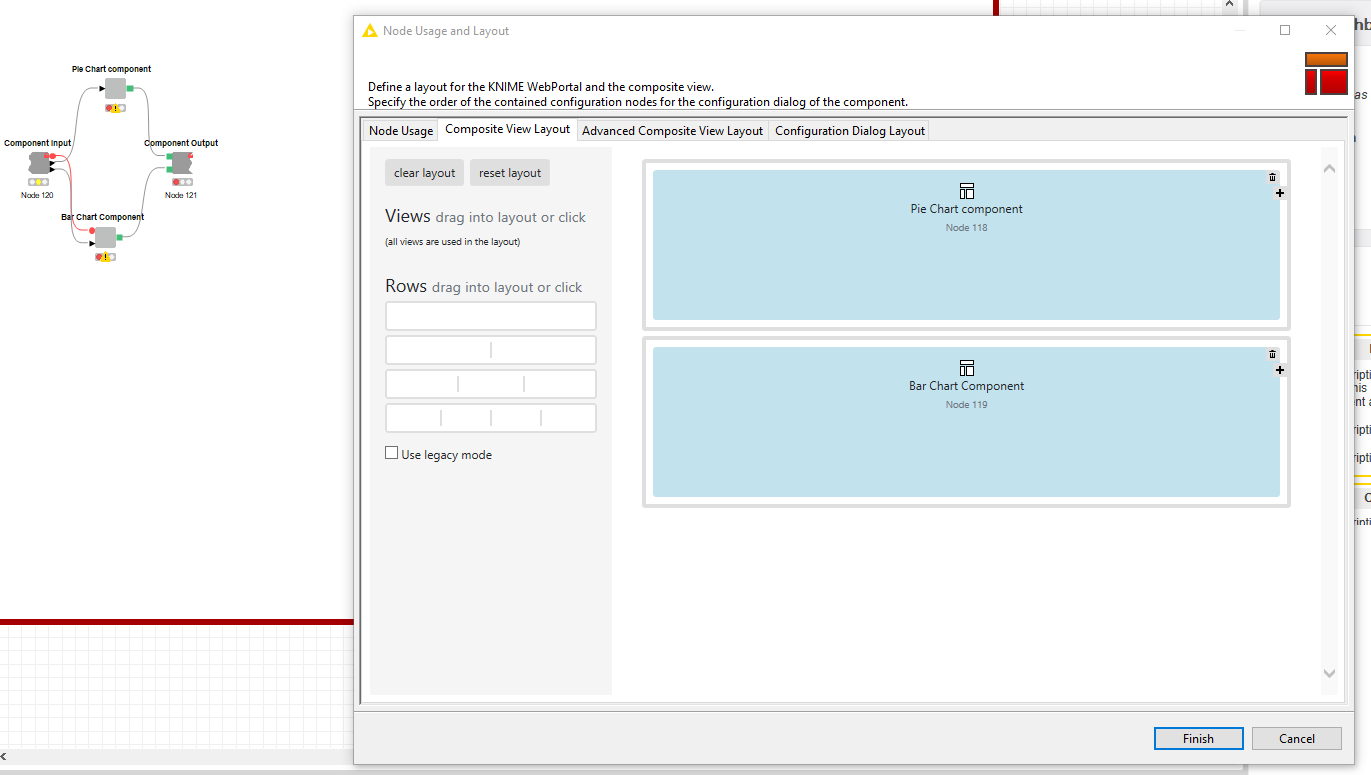
Hi @USCHUKN1ME as @ipazin suggested create ONE component with both graphs. You can define the layout in the screen you are showing: Use the second row below the “Rows drag into layout or click” as stated, the drag each graph to the position you want (right or left). That should do the trick

1 Like

Hello @USCHUKN1ME,

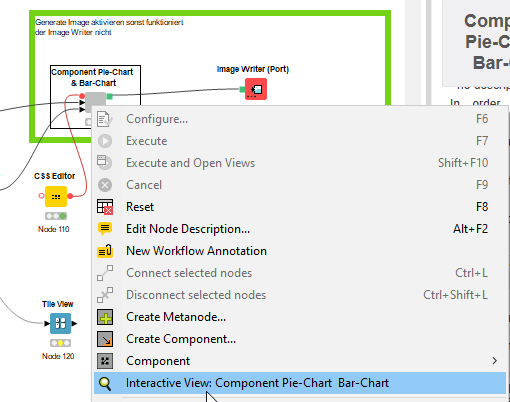
glad you managed to deal with first point. Regarding second one what exactly is your goal? Show Pie Chart and Bar Chart in same view and then export that view as one file? To do so you can right click on view and choose Save As... Or you want to save it as two separate files? Or?

Br,
Ivan

1 Like

Hello iperez,

ok, i did it:
Component-zusammengefasst fĂĽr PIe und BAR Chart

It seems to work. :+1:

How or where can I display the “Dashboard” now ?
What do I need for this?
The KNIME web portal / server?

Thx in advance!

greetings

If you are using KNIME AP when you Execute the componment (by Execute and open views) it will show on your local machine. If you want to display it for a broader audience you need the Server, which gives you acces to the Web Portal.

1 Like

Hello iperez,

Ok - this is one way i guess:
Component interactive View Pie und Bar Chart

Thank you for the support :+1: :slightly_smiling_face:

greetings

2 Likes

Hello Ipazin,

I would like to display the two generated charts side by side in the browser (firefox). I managed to do that with the component node.

Greetings

2 Likes

Hello @USCHUKN1ME,

got it. Glad you figured it out :+1:

Br,
Ivan

2 Likes

This topic was automatically closed 182 days after the last reply. New replies are no longer allowed.