3D model of river -> determine type of shore.

Dear readers. For me this is a first try at machine learning, so please talk to me like a five year old!

In the Netherlands we have 3d maps of our rivers. I want, with the help of KNIME/ML to automatically determine the type of shore. To make it easy for now lets use 1 type: Nature Friendly Shore (NFS), and ‘type 2’ NOT a NFS.

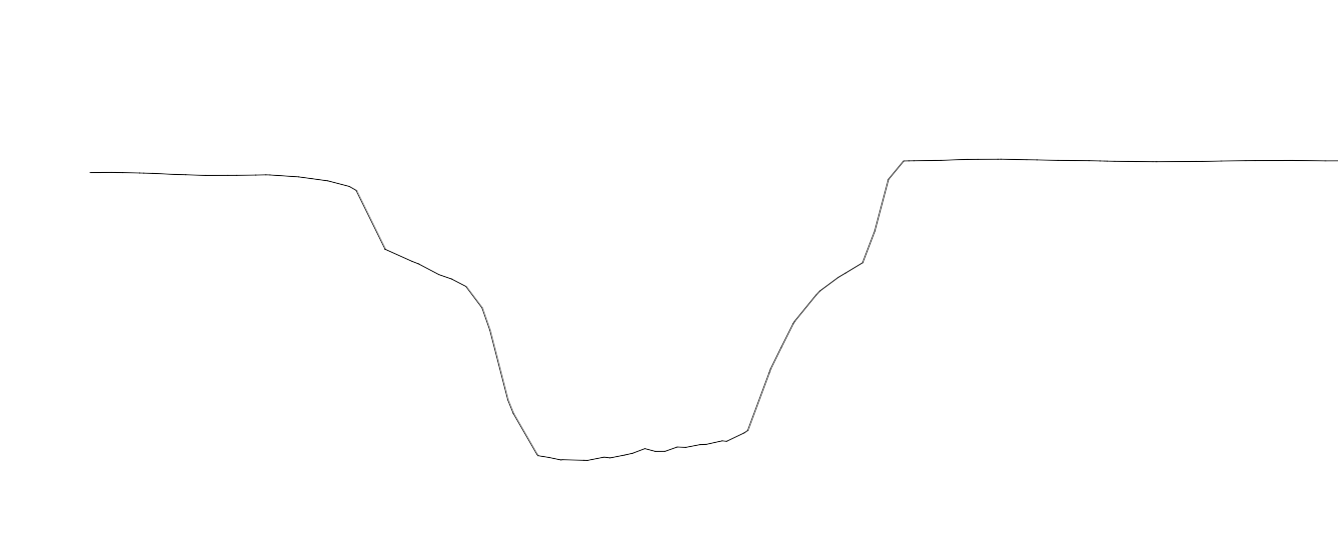
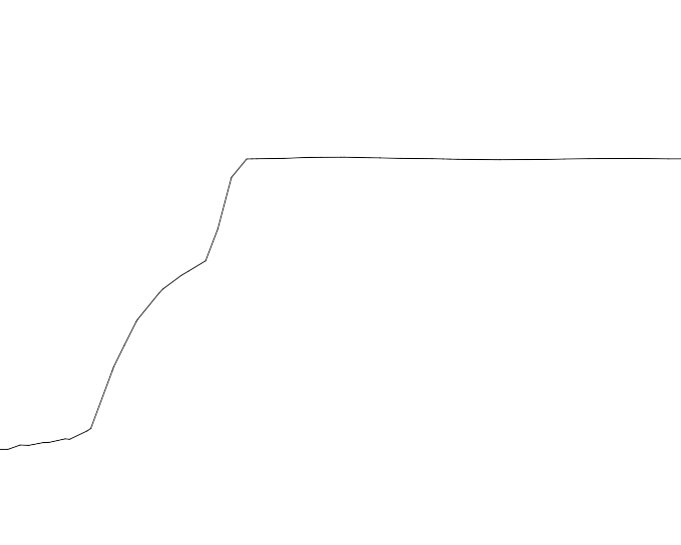
Type 1 roughly looks like this

The angle is always a little bit different; bet never near vertical.

My current plan of attack looks like this:
1/ Determine vector (Blue arrows) of the river. Exporting the purple line to excel will create 2d x,y table with which I can determine de vector AND de geo location.

2/ Create the section cut; should be 90 degrees angle form the vector (Orange below)


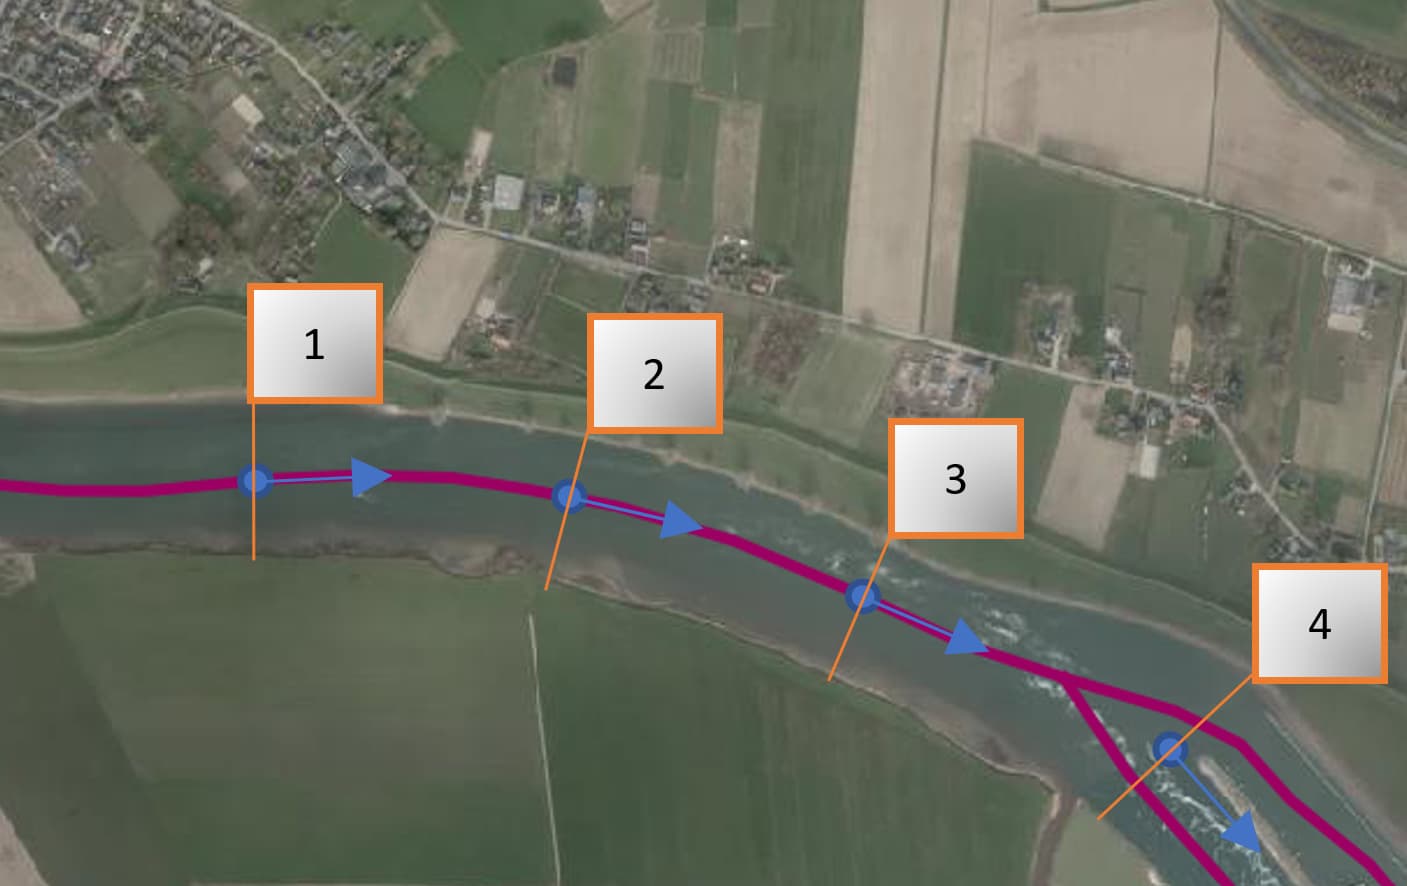
Section cut from number 2; left and right likely to be a NFS.
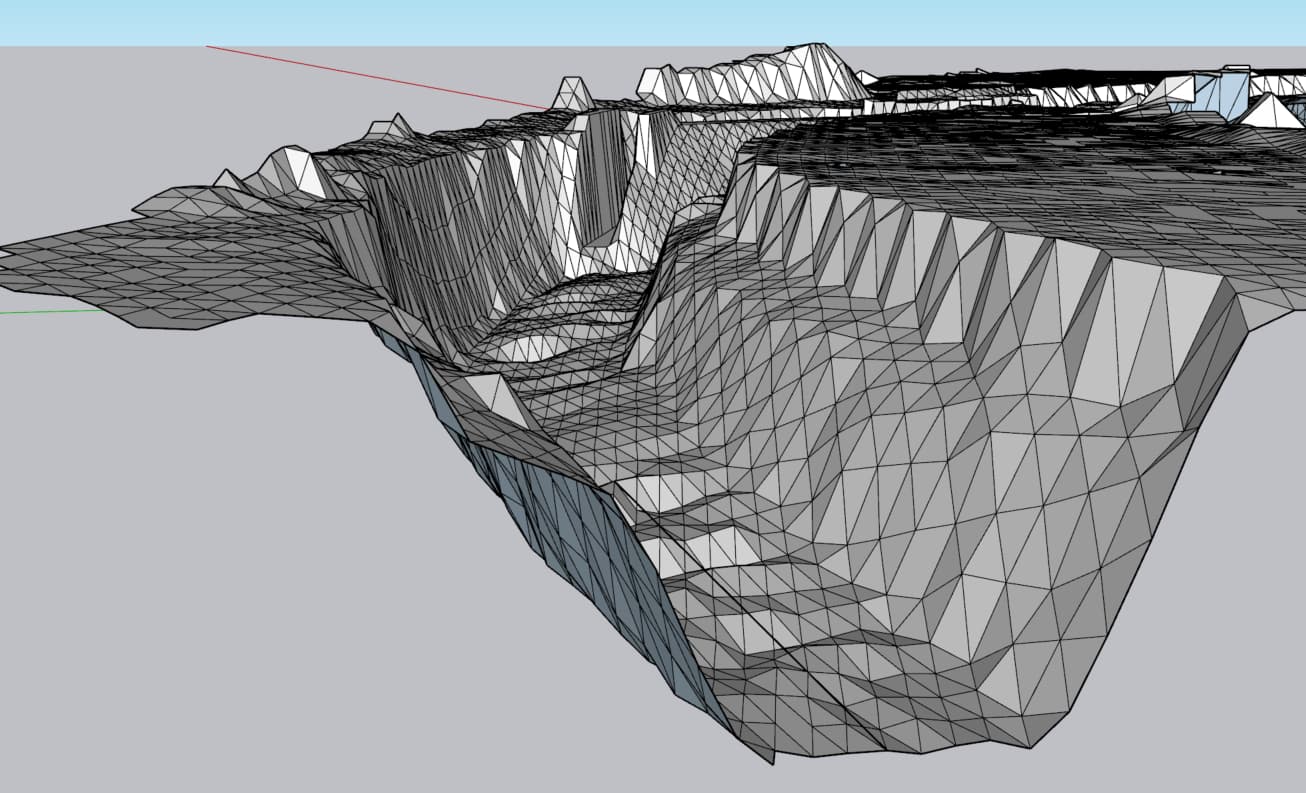
The 3d model:

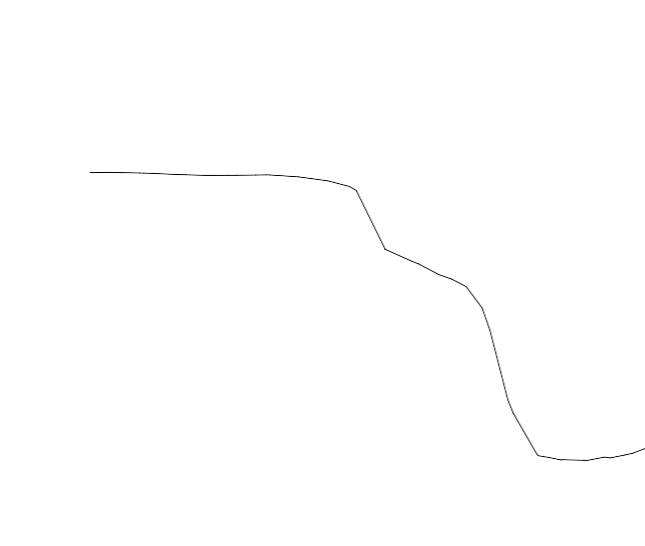
3/ Split section cut:


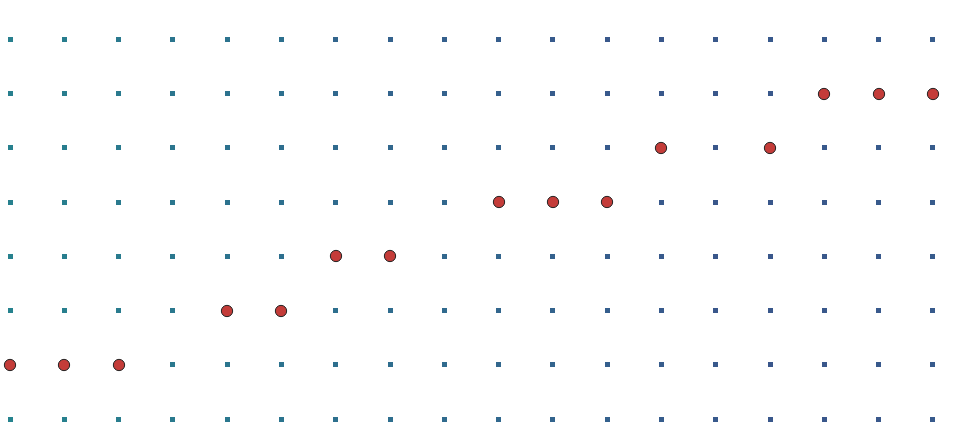
4/ We can create a X,Y plot; lets say N x point resolution per side.
With this we get a list of all section cuts and the x/y coordinates from the 2d section cut:

Section: x1 y1 x2 y2 x3 y3 until N

1Left 0 200 1 180 2 150 etc…
1Right
2L
2R etc…

De x,y coordinates will be the input layers of the model.
I have some geo data that dictates, in specific area’s, which parts are NFS’s. So I could use this to create a learning dataset.

Questions if you think this is a good plan of attack:
1/ How do I automate the conversion from XYZ 3D data to section cuts based on the vectors? I think I have the data i need, but how to convert it to XYZ 2D lets say? There should also be a geo element to this; because I need to now the geo location of each and every section cut!

2/ I have no idea of performance. The section cuts I placed above have a per side resolution of around 25 (50 in total) So there will be 25*2 input layers (2 because of x AND y)
I don’t mind if the whole river takes a week to calculate. Months on the contrary would be a little bit too long :slight_smile:

I would really appreciate any and all input !

Thanks in advance!!

6 Likes

Hi @Robertoal and welcome to the community!

Wow, this sounds like an exciting and challenging project! From the 2D cuts, I would expect that something like the average angle of the shore is already a good predictor whether a shore is NFS or not. I’d expect ML would probably only be interesting to classify the cuts into more types of shore. But as you said, the challenge for now is to automatically preprocess your data to get out a the shorelines for each position. Your general plan of attack looks quite sound to me; regarding the tools to use let me give my 5 cents to it:

Honestly, I’m not quite sure whether I would recommend to use (only) KNIME for that: Determining the river trajectory (I understand you have these already?), calculating the normal vectors (with splines?) and creating the section cuts from the 3D map sound more like tasks for python to me. I personally would use the jupyter notebooks to do the python development part, as they allow for easy visualization in between steps.

Once you have a (training)-table with the cross sections, label with the shore type, shore side (L/R), shore identifier (long&lat),… , you’d need to decide which model to use for classification (as mentioned, if the average shore angle is not already a well enough predictor): this is where KNIME could be the right tool to use - especially the AutoML component could be interesting for you there. (Of course, you can always incorporate the python part with a python source/script node and go on in KNIME from there :slight_smile: ).

Regarding your two questions (since I think your plan of attack is excellent):

  1. As said, I’d create the cross sections with Python. The other part of the the question aims at how to map the river trajectory to the 3D river data, right? This depends on the data itself, but I would assume that the 3D data comes with some sort of location identifier? With that you should be able to map the xy(z)-3D-map vertices to the x-y-data of the trajectory.
  2. Performance-wise this shouldn’t really be an issue, neither in KNIME nor in Python.

Hope that helps!
Best, Lukas

3 Likes

thank you very much for your amazing response! So cool people here helping each other :slight_smile:

I would expect that something like the average angle of the shore is already a good predictor whether a shore is NFS or not.
You probably have a point here, although sometimes there is a little ‘hump/dam’ before the NFS which makes that idea i guess a little less viable? and of course the reason to go ML is to add objects in the future if this works! (Like hardened shores, or even dams, passages for fish, Macrofauna locations, etc.)
I personally would use the jupyter notebooks to do the python development part, as they allow for easy visualization in between steps.
I went looking for python solutions and i found a library that can make cuts of a 3d model, so thanks a lot for this tip! Sometimes you just need to know where to look :slight_smile:

this is where KNIME could be the right tool to use - especially the AutoML component could be interesting for you there.
cool! I will take a look at that when i have my dataset ready.

1/ The current 3d model does not have a geo location ID. What i CAN do i think is to use the same RD geo component (which is just x, y) and convert that to the 3D coordinates (or make them the same.) this is something i have to practice with!

2/ Good to know! I indeed already calculated the vectors from a test location (2km in length) which makes around 500 points to cut, and calculate. For the whole river this would be around 30k /50K data points/not a lot for modern computer I guess!

To sum things up:
So my workflow will be:
1/ convert GEO polylines to point and calculate angles/vectors (DONE!)
2/ convert geometry of RD to points to 3d space (So we have the right vector at the right place)
3/ Use the library to make a cut from the 3d model using the vector data (and use the RD coordinates)
4/ Using CSV/excel format to output the data in a file that is readable by KNIME
5/ Create training dataset based on available GEO data of NFS locations
6/ Use KNIME AutoML component (thanks Lukas!) to make the prediction model.

Thanks again Lukas for you help!

Cheers,

Rob

2 Likes

Hey Rob,

you’re very welcome, always glad to help! There’s always something to learn: I didn’t know that the Netherlands have their own Coordinate System (RD) :smiley: If you want to stay in python to do the conversion, maybe this library is useful for you? (It seems really to be only two functions, so you could just copy past these).

If you will be using the Jupyter Notebooks, you can check out this Blogpost on how to integrate the KNIME in JN and the other way around. This way you could avoid CSV/Excel files.

Have fun!
Lukas

1 Like

Hi Lukas,

I should have clarified that! Sorry :slight_smile:
But indeed especially in the government we mainly use RD for projects.
The library looks very useful indeed! Thanks!

I will look into that KNIME and JN integration, but to be honest it is quite overwhelming all the information! So step by step. Especially the python library’s with the different dependencies is giving me trouble in windows… Even with anaconda … So a lot to learn!

If I solve the problem I will post my conclusion here so other people can hopefully benefit!

Cheers!

Rob.

2 Likes

Update time!

Unfortunately the library with 3D method is quite slow, and hard to get working correctly with all the dependencies. So i went a different, faster, route:

I now use the 1x1m grid of measurements: X, Y, Z.

  1. From an midpoint from the river coordinate input, with a vector, i calculate a line of which i want to make a section cut.
  2. This line is 200 meters long, which is not the exact width of the river. So I found a data source that approximates the shore line. With GeoPandas library i calculate the intersections of the line with the two shores.
  3. I have fixed resolution of 120 points right now. I divide the river width with 120, so i have 120 datapoints. On these points i do a nearest neighbor analysis. The output is the nearest point from the XYZ model to every point in the line, which creates a somewhat accurate approximation of the section of the river. Top view looks like this:
    image

NOTE: the XYZ measurements, because of the multi beam technology, only reach to about 600cm’s in depth; this means that the measurements are almost never to the very edge of the shore!
4. So now i have a nice list of depths. But there is a gap between the last point of the multi beam, and the shore. I can probably interpolate the depths in between.
Zoomed in it looks like this:


The red points are the one calculated by the NN method. Although i am missing some points its not a big problem i think (and otherwise i just up the resolution)

Now on to my question:
My output is an array, in this example with a fixed 120 resolution.
This contains two shores of course, so COLUMNS are as follows:

MIDPOINT X
MIDPOINT Y
RIVER WIDTH
LEFT/RIGHT SHORE
DISTANCE TO 3D DATA
60 (Not 120) COLUMNS WIT Z DEPTH

The problem that arises is that I don’t have all the data in the gap between the last point of measurement, and the shore line. AND the width is different as well.
What is the best way using this data in KNIME? Just interpolate the Z values in between? I want to pass through all data except the X/Y coordinates.
Which ML model is most appropriate in my case?

Thanks in advance for the help again!!

2 Likes

Hi @Robertoal,

I’m very sorry for the late answer: Great work so far!

Indeed this is a tricky situation with the “Gap” between shoreline and measurement - I’d see this as a refinement step and come back to that at a later stage*. For now, I’d go with the data you have.

So the next thing to do would prepare the training and verification set - to classify the shores, you need some ground truth to teach the model. That’s your step “5/ Create training dataset based on available GEO data of NFS locations” which should give you another column “target” which holds the class of the shore (NFS, not NFS, …). The table would then be ready for the AutoML component, with which you can find out the best performing model. This gets your concept going and finetuning is the next thing to do **).

Hope that helps!
Lukas

*) I’d interpolate the whole heightmap (You’re on python for this, right? Then see e.g. here for interpolation :slight_smile: ), get equidistant points on the line from shore to shore and ask the interpolation function to return the Z-value for these points.

**) If the model(s) spit(s) our garbage, this could be a normalization issue: As it is now, the model thinks the river is 120 data points wide with no understanding of how far each data point is apart (yes it has the river width, but I doubt it will link that information properly). Wouldn’t the most interesting part of the river be the first 20m or so from the shore? You could sample your line on these first interesting meters and get 60 equidistantly spaced data points that way. To be sure that only the rivers profile is used in the classification, I’d probably even prepare the table such that it only has the target column and the 60 “profile” columns.

Hi Lukas!
Thanks again for the reply; you are amazing!

So I implemented the step where I check if the cross section line crosses a known NFS point; this works now so I can create the training and verification step.
Thanks for pointing out the component, can’t wait to play with it!! I learned that 90% of ML is creating/cleaning/finding datasets:slight_smile:

  • Thanks for the interpolation link! A lot better than what I did now (Just a linear interpolation…)

** I think you have a very valid point here. The thing is; the width of the river fluctuates a lot, and it is good to know that in the rivers there is always a very deep middle bit; this is kept this way by dredging so ships don’t have trouble navigating the waters.
This can mean that, if we use a fixed width, it sometimes uses a big part of the deep water as well on the points at where the river is not very wide… Hmm…
But your point that the algorithm needs to ‘know’ the distance between the datapoints is a good one. So is there some way to ‘force’ the algorithm to connect the datapoints AND the river width?

I have another question to run by you…
I found a high resolution (25cm/pixel) IR map. It SEEMS that whenever there is a NFS the pixels at that location are lighter and run deeper into the water, so this seems another good datapoint to collect.
So i found a way to download the relevant data from the coordinates (and somewhat performant as well!)
Can I implement it like this:
For every nearest neighbor point found by the algorithm, create a number between 1 and 0 for how near a pixel is to a light sand colour. I can use something like 10x10 pixels, and get the median for it?
There are a couple of downside for this; one of them is performance. So I did some tests with this and it seems to take around 0.8/2 seconds to load for every cycle. It takes around a day longer this way… but not the end of the world!
Another downside I can think of is that the algorithm doesn’t know that it is infrared data. Just like it doesn’t know if something is depth. I can imagine this being a problem?

Thanks again! Looking forward for your reply.

1 Like

Hey Rob!

Thanks for all the praise - lets see what will come out :smiley: 
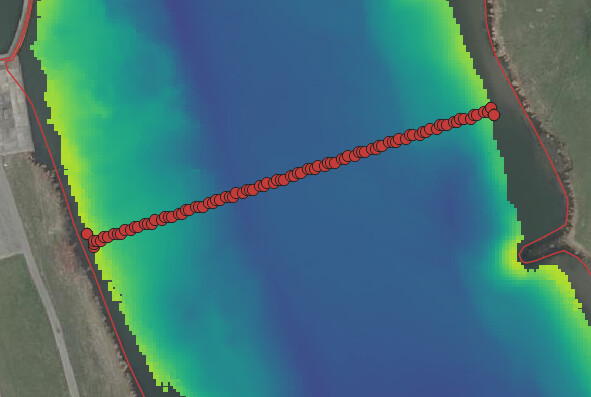
And thanks for the update, great that it begins to work out!

Very true with the 90% :smiley: The largest chunk of work seems to massage the data into a consistent format with constant number of features (=columns), good normalization, … And all that by not changing the relation between features.

Hmm, I wouldn’t know of a way to force the connection between river width and datapoint distance - I’ll have to think about that. But honestly I don’t know if that’s really a valid concern - I’d just try what you have and see what comes out - optimization and refinement are probably the remaining 9.999% :wink:

Out of interest, do you know more about this IR measurement? Its the reflection of infrared light, I guess? What would that tell - the amount of biomass/mud/algae in the water or something like that? So this sounds definitely like a good estimator whether the shore is NF or not! I’d probably try to do the same as with the cross sections: interpolate 60 points from the shoreline on the IR-map and introduce them to the table as you did with the shape points. Again - I’d only do that once you have your first model going. Introducing new features then allows you to really tell what difference it made.

I’m excited for the next update, thanks for sharing!
Best, Lukas

1 Like

I was thinking this trough… would’t it be good enough when I use i fixed width;
So i use lets say the max width of the river which is around 200 meters. (this is the size of the array as well) do the NN analysis until there are no more 3d points left.
From this point I check the distance until the shore and, using your suggestion, interpolate the Z values in between.
So lets say this part is 100m in width; I pad the rest of the array with just ‘zero/null’ values. The middle point of the array will always be the middle point between the shore lines.
Is this something that could work?

I am still waiting on the 3d dataset that is almost 90% sure of the definitions of NFS objects. (which will make the perfect trainingset) Until I have this dataset i will keep making this part better!

1 Like

Hi Rob,

I’m coming back to you only now because I first got back to @Kathrin who is much more ML Experienced than myself - she suggested the zero padding as well. You’d only have to closely investigate the results then, because it could be that the model learns that any broad river with only a few 0s is always NF and vice versa (if this relation is in the training dataset). Additionally, she suggested to add in the incline of the river at each point as well as an additional feature, which I think is a great idea (it’d be worthwhile to compare the model with and without the additional feature).

On the broader picture: The dataset which you built during preprocessing with the cross sections of the rivers along with their shore-type-label is a very valuable resource, which I bet is worth investigating manually as well. A simple histogram of the river width or average incline as a function of shore label might already give valuable insights. “Unifying” the dataset to put it into a machine learning model can then be done in a number of ways - and these ways need to be compared to each other in order to find the best working one. Let’s see what comes out with the sampling approach and 0 padding, we already have some ideas for alternative approaches :slight_smile:

Cheers!
Lukas

Wow! Some service you guys are offering!!
Thanks @Kathrin!!

I just integrated the 0 padding in my code (Sorry it takes so much time! Its my first time with python and I find it not to be so easy :-0 )

About implementing the incline of the rive shores; do you mean the ‘mean’ value of incline? Or for every Z depth value another value with the incline?
Sound like a great idea, and easy to implement as well.
As an additional feature i could use infrared data? What could be a nice idea is the following:
For every coordinate download IR data with a 4x4 pixel grid. (one pixel is 25cm) Convert it to black and white; create a number between 0 - 1. The lighter the pixel is the higher the value. Because the depth looks like it is directly relatable with IR colour value, we do: Z depth * IR value (0-1).
This creates a hard link between the depth information and IR images?
The other option is to just add the IR info, so the table would look like this:

Section 1: depth, IR value, incline, z depth, IR value, incline, ETC
Section 2: depth, IR value, incline, z depth, IR value, incline, ETC
And so on.

About the second point:
I think you could be right! Although my gut feeling (very sciency i know!) says that I should the IR data because 80% of the time when somethings is an NFS the shore has a sandy colour. For example:


The yellow line is almost certain an NFS. Note the following in this picture:

  1. There is a lot of sand (the lighter pixels) when its an NFS!
  2. The brown line is quite erratic and indicates the quality of the dataset i have to work with :frowning:
  3. The blueish pixels is the 3D information I have available.
  4. As you can see i can’t just use the shore line (which I thought i could… i should have known and triple quadruple checked… but people told me the dataset was ‘mint’…)

It looks like the learning data set will arrive in about 2 weeks! Can’t wait to try everything!!

Thanks again for all the trouble!!

1 Like

Hi Rob,

gut feeling is actually a very important thing for a scientist, if you ask me :wink:

I’d take the incline at the points of the depth and the raw IR value as well, so that you end up with a table just like you proposed - keep it as simple as possible for now, you can later always experiment with your features and creating correlations manually with such formulas (i.e. “hard links”).

Yeah, the quality of the datasets is always crucial and an issue! The yellow line you drew in manually, I suppose? And the brownish one is an automatically generated shoreline? Do you know how the shoreline was created and do you have a handle on that to improve it? Maybe some smoothing might help to get rid of the extreme bumps - the UnivariateSpline from SciPy might help? Check out this post on stackoverflow for examples. You can of course try and come up with a process of doing shorelinedetection yourself, e.g. based on the satellite image, but I suppose that’s overengineering :sweat_smile: I’d suggest: just try what you have now and finetune later!

Looking forward,
Lukas

Thanks for the input.

I will do as you propose! Will take some more time programming… but I think it will improve the working of the algorithm a lot.

About the yellow line; I did that one by hand, indeed. The brown needs some clarification:
So in the Netherlands after a specific project that changes the ground in whatever way, there needs to be an official push with the new data that reflects the new situation.
This happens often by people that don’t really know why they are doing the thing that they are told to do… this means the quality of said data, although done by hand, is often like this; not very good!
Detecting shoreline would in the future be a very next level thing to do! But first lets finish this project :slight_smile:

Thans for the smoothing idea (should have thought of that myself.) I would rather do it in qGIS; this way i can use the dataset for different purposes.
The downside about smoothing is that sometimes a shoreline really is quite erratic; this shouldn’t be smoothed out because it is an indication of a dynamic shore line (which is another object I would like to determine in the future).
So I will try smoothing only when there are peaks like this!

Wish me luck :rofl:

Cheers.

1 Like

This topic was automatically closed 90 days after the last reply. New replies are no longer allowed.