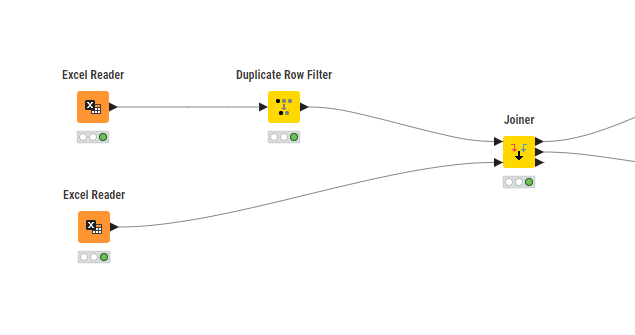
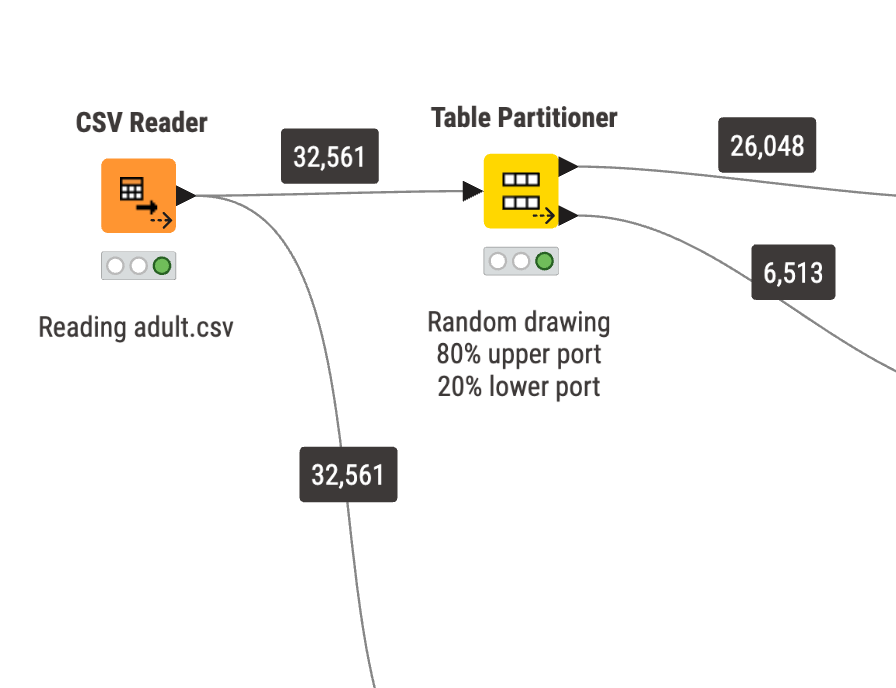
You cannot see how the data is flowing. Of course you can create validation checks, error messages and so on, but wouldn`t it be great to see the number of records?
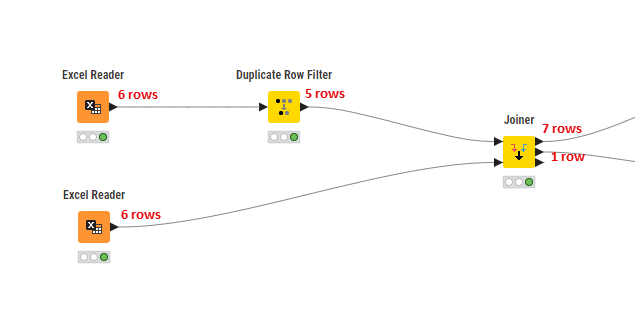
Here you have many clues of possible issues just by looking at the workflow. Duplicates were removed, inner join is generating additional rows and I have a record that wasn`t join. No additional tools needed, only a 5-second review of your workflow.
Thanks for the suggestions. I`m aware of those and that is how I’m currently doing.
Having the number of records across all nodes at all times (optionally) gives you a better idea of what is happening in your workflow, even when you are not looking for those errors.
The image I shared shows 3 possible (and unexpected) issues in your workflow that you can identify in just a few seconds.
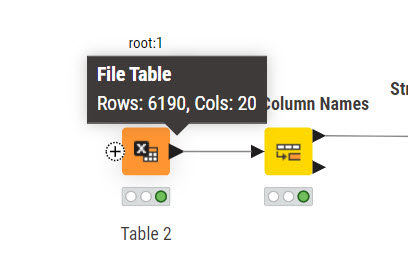
Imagine hovering over or adding the row count annotator to a workflow with 50 nodes, which is not that many. Imagine how long it would take you to review your entire workflow or build control checks just because you don`t have those numbers handy.
Either way, I genuinely appreciate the feedback and suggestions.
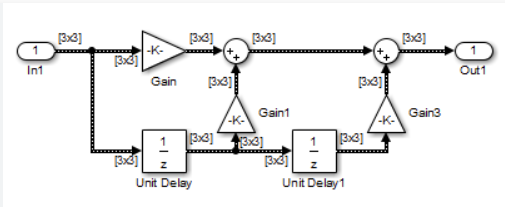
Some time ago I worked with Matlab Simulink, which is graphical programming tool as well. There is an option to display the shape of the data which is transported from one node to the next.
I think it’s a good imporvement, but can lead to very dense visualisations. Especially in large workflows…
We have this idea already in our ticket system (NXT-4325). I agree with @ActionAndi, so there has to be some setting to show/hide it otherwise a huge workflow with a lot of connections will be crowded.
Inside a component (with simple streaming) there is something in this direction available.