Sure, here you go.
BEFORE - 0 to 2 % Load
80657 Knime 5-3 High CPU Load BEFORE accessign Hub - threaddump-1719836794855.tdump.txt (122.1 KB)
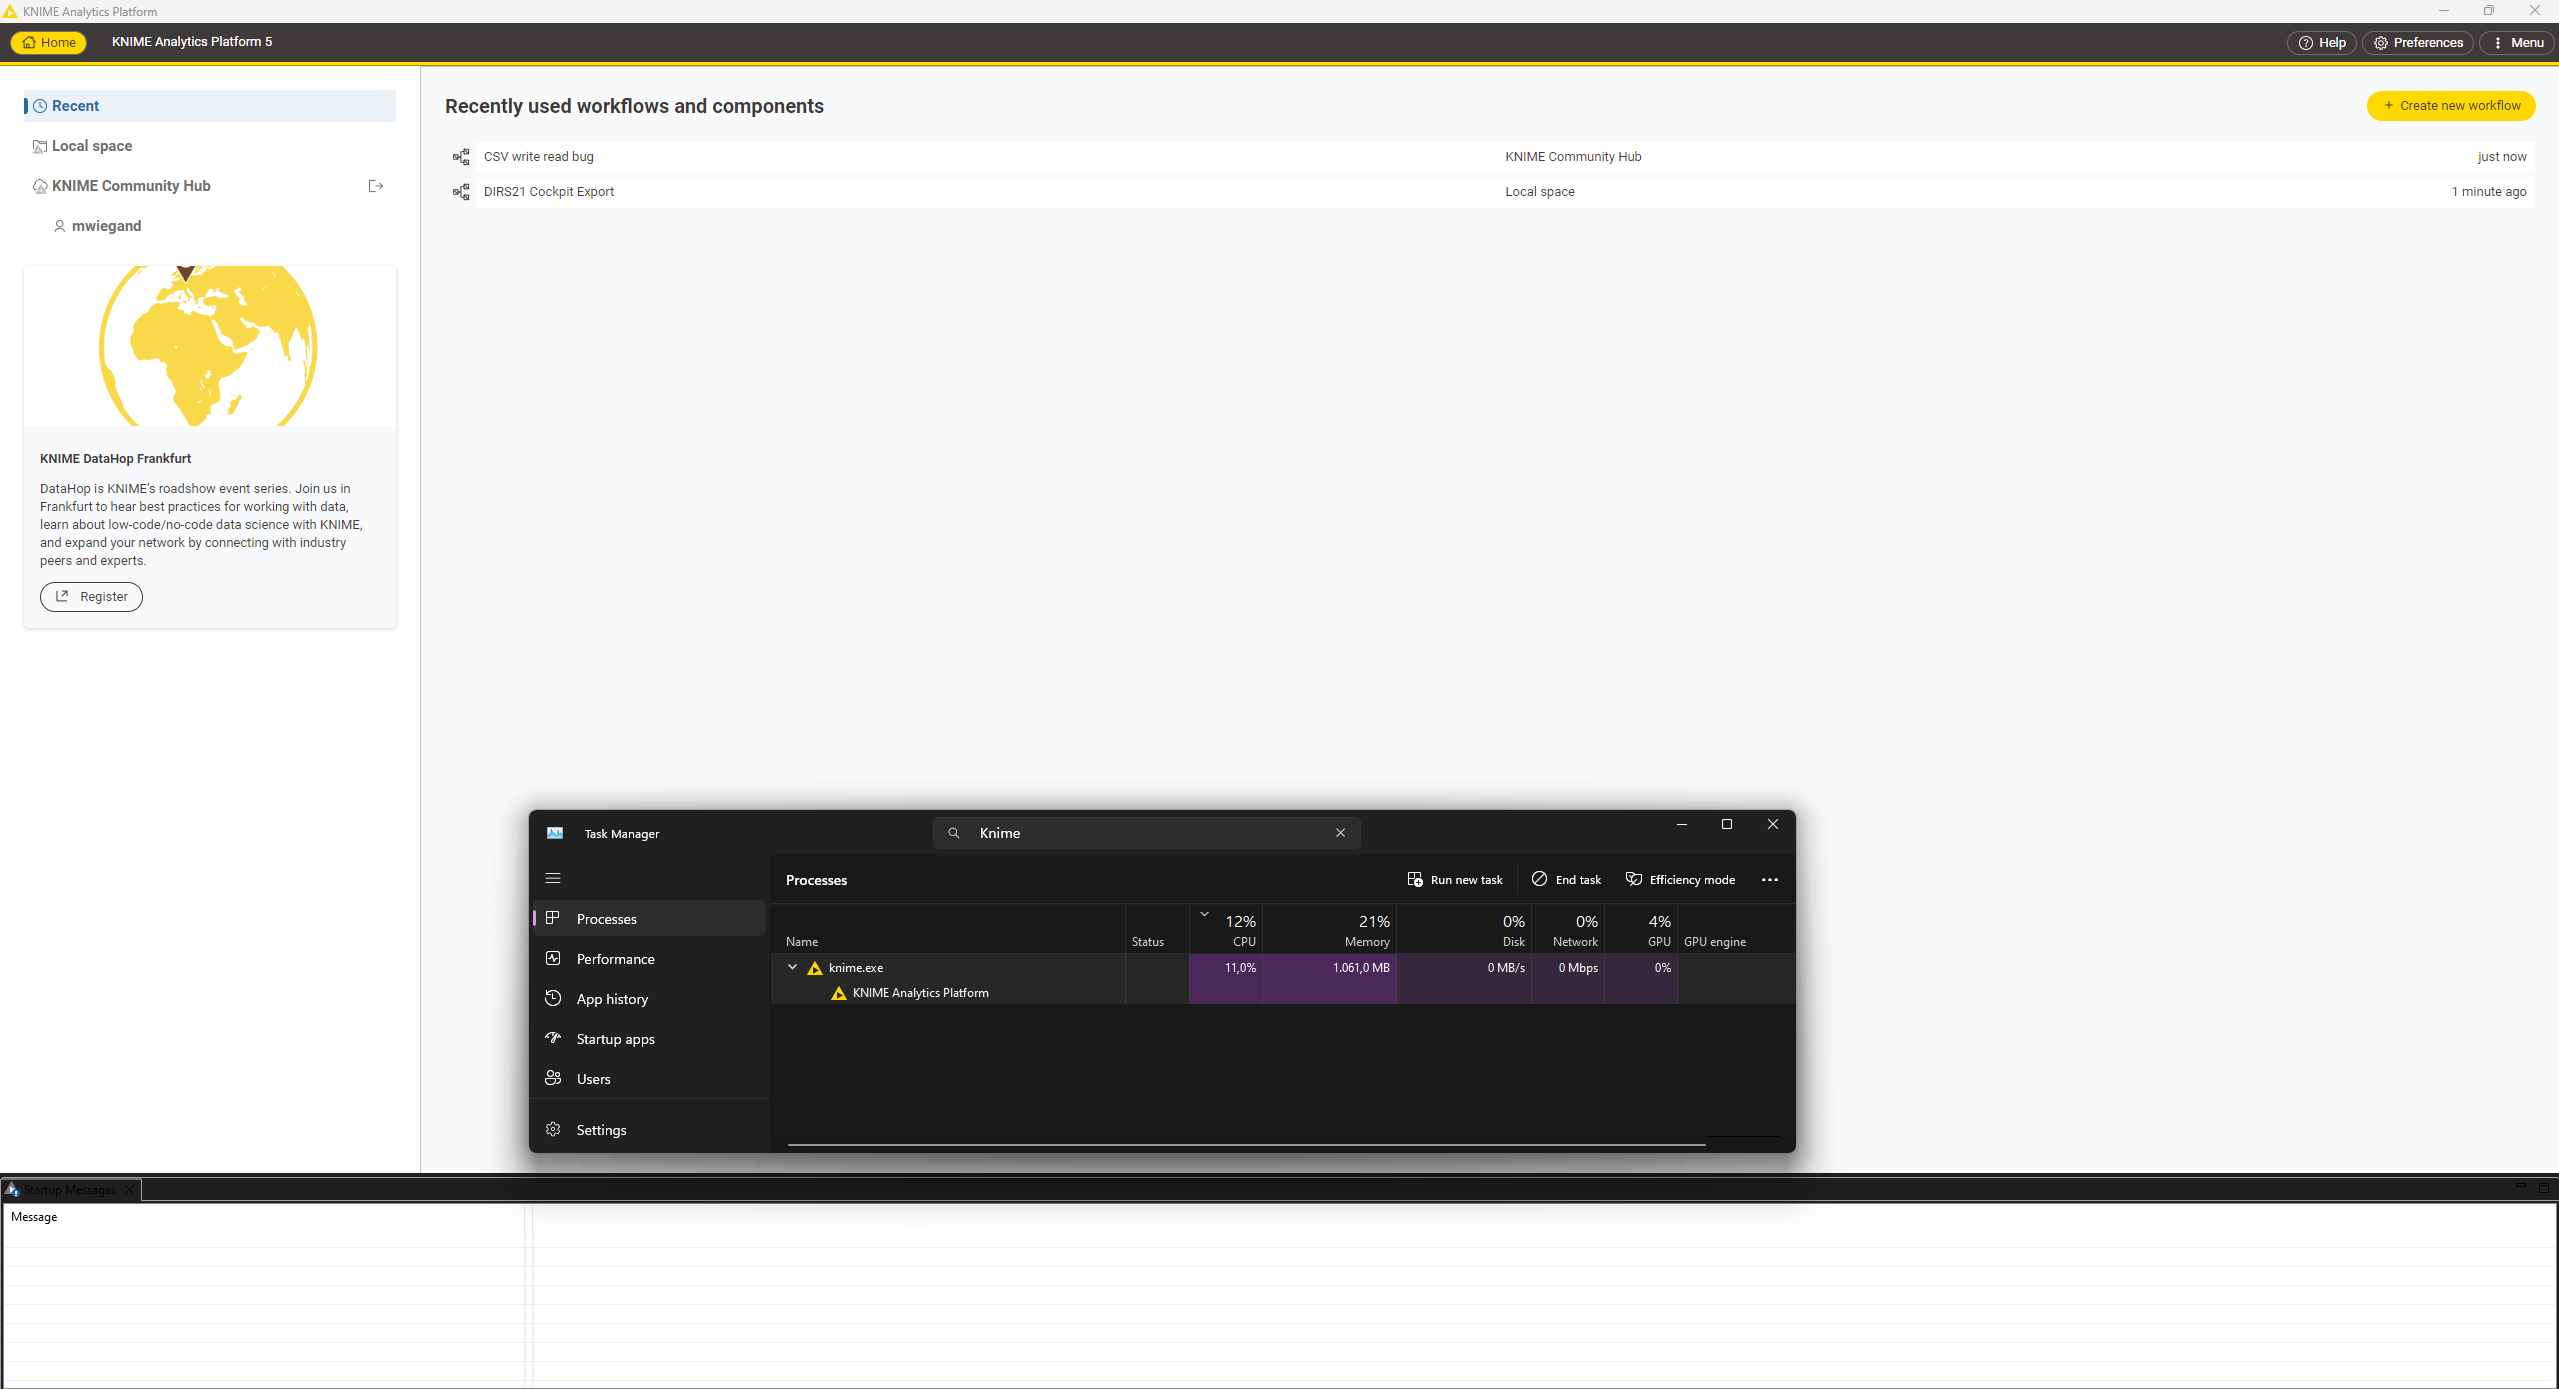
AFTER - 8 - 12 % Load (on 4 Cores)
Only logged in, nothing else. I also downloaded the full zip starting with an “unused” app folder
80657 Knime 5-3 High CPU Load WHILE accessign Hub - threaddump-1719836862095.tdump.txt (111.5 KB)
Update
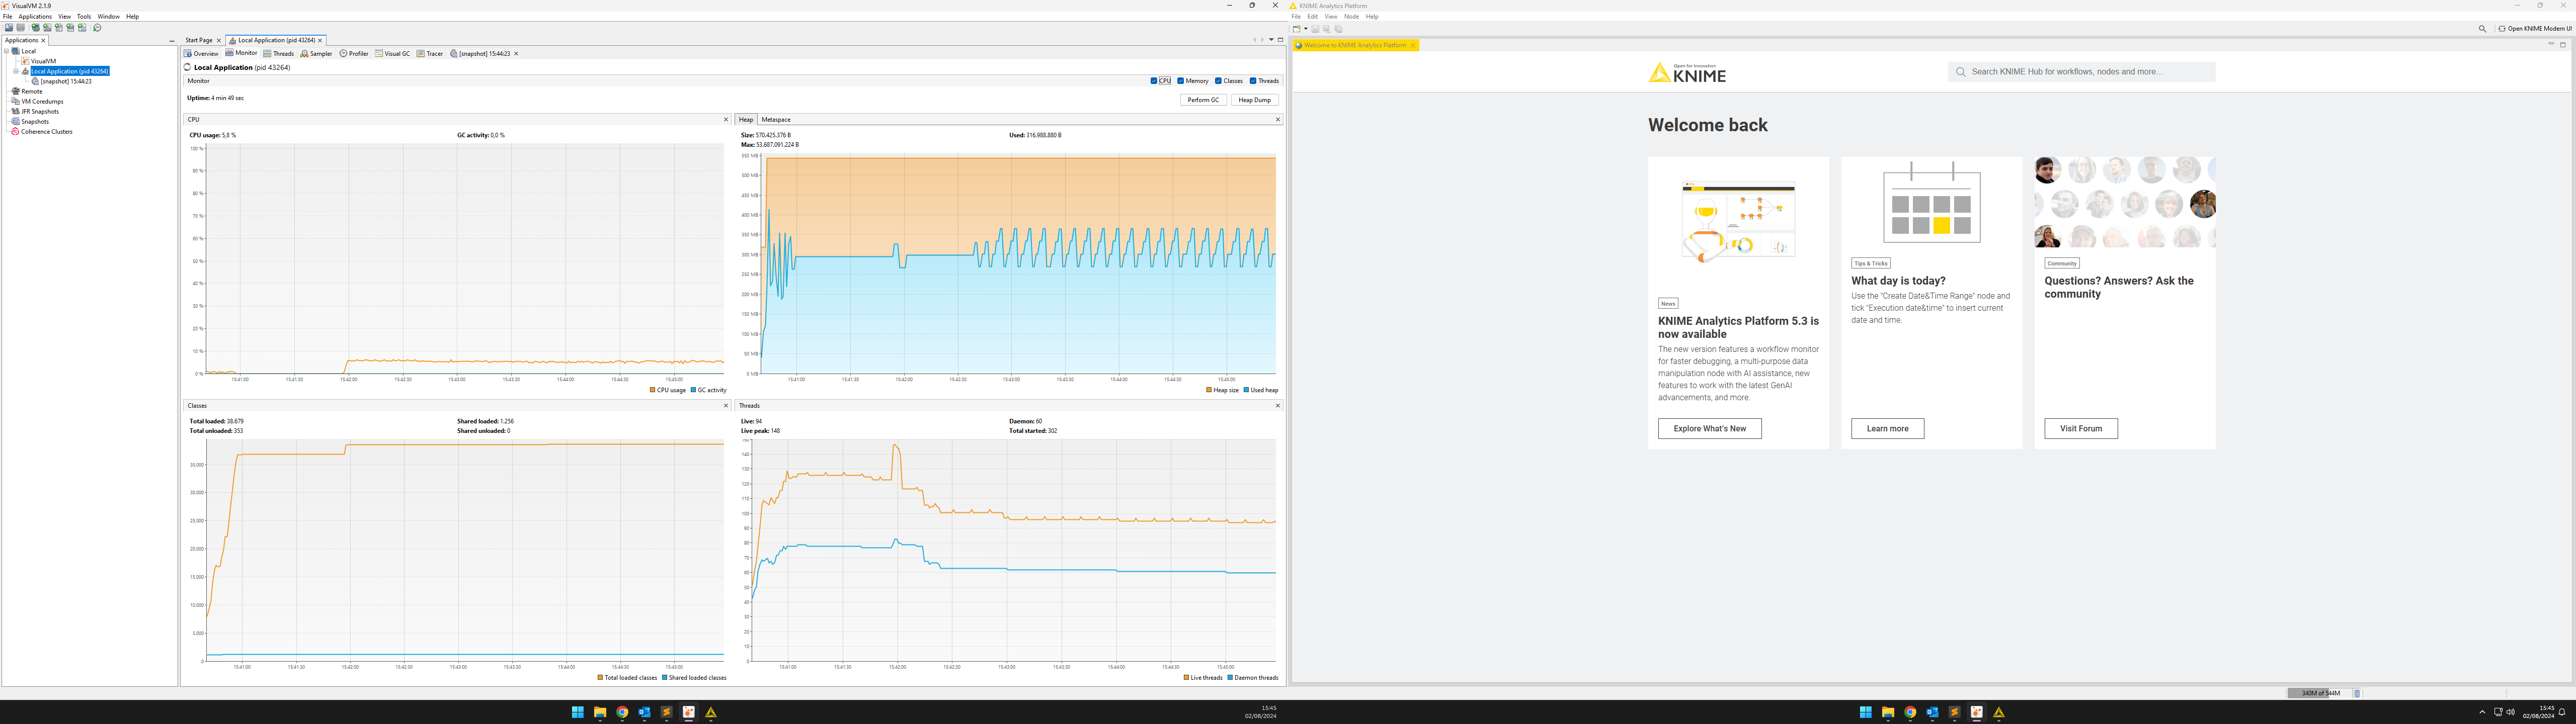
In an effort to find possible explanations I used some extensive system monitoring trying to figure out what is happening. The tools used were:
Fan Control: Using properly adjusted fan control as an indicator of higher CPU utilization
Microsoft Sysinternals Porcmon and Process-Explorer as more advances means to assess processes compared to the task manager i.e. also allowing to monitor network traffic
Microsoft WinDbg to analyze the threads of a process of dumpfiles.
HWiNFO® 64 Pro to check hardware details like power consumption and double verify i.e. CPU utilization
What I found was:
BASELINE: System IDLE - Knime and all other main apps closed
- Temps and wattage as expected
DEFAULT: Knime Started but not connected to Hub
- Temps + 5 to 8 C°, Wattage ok, no significant fan utilization
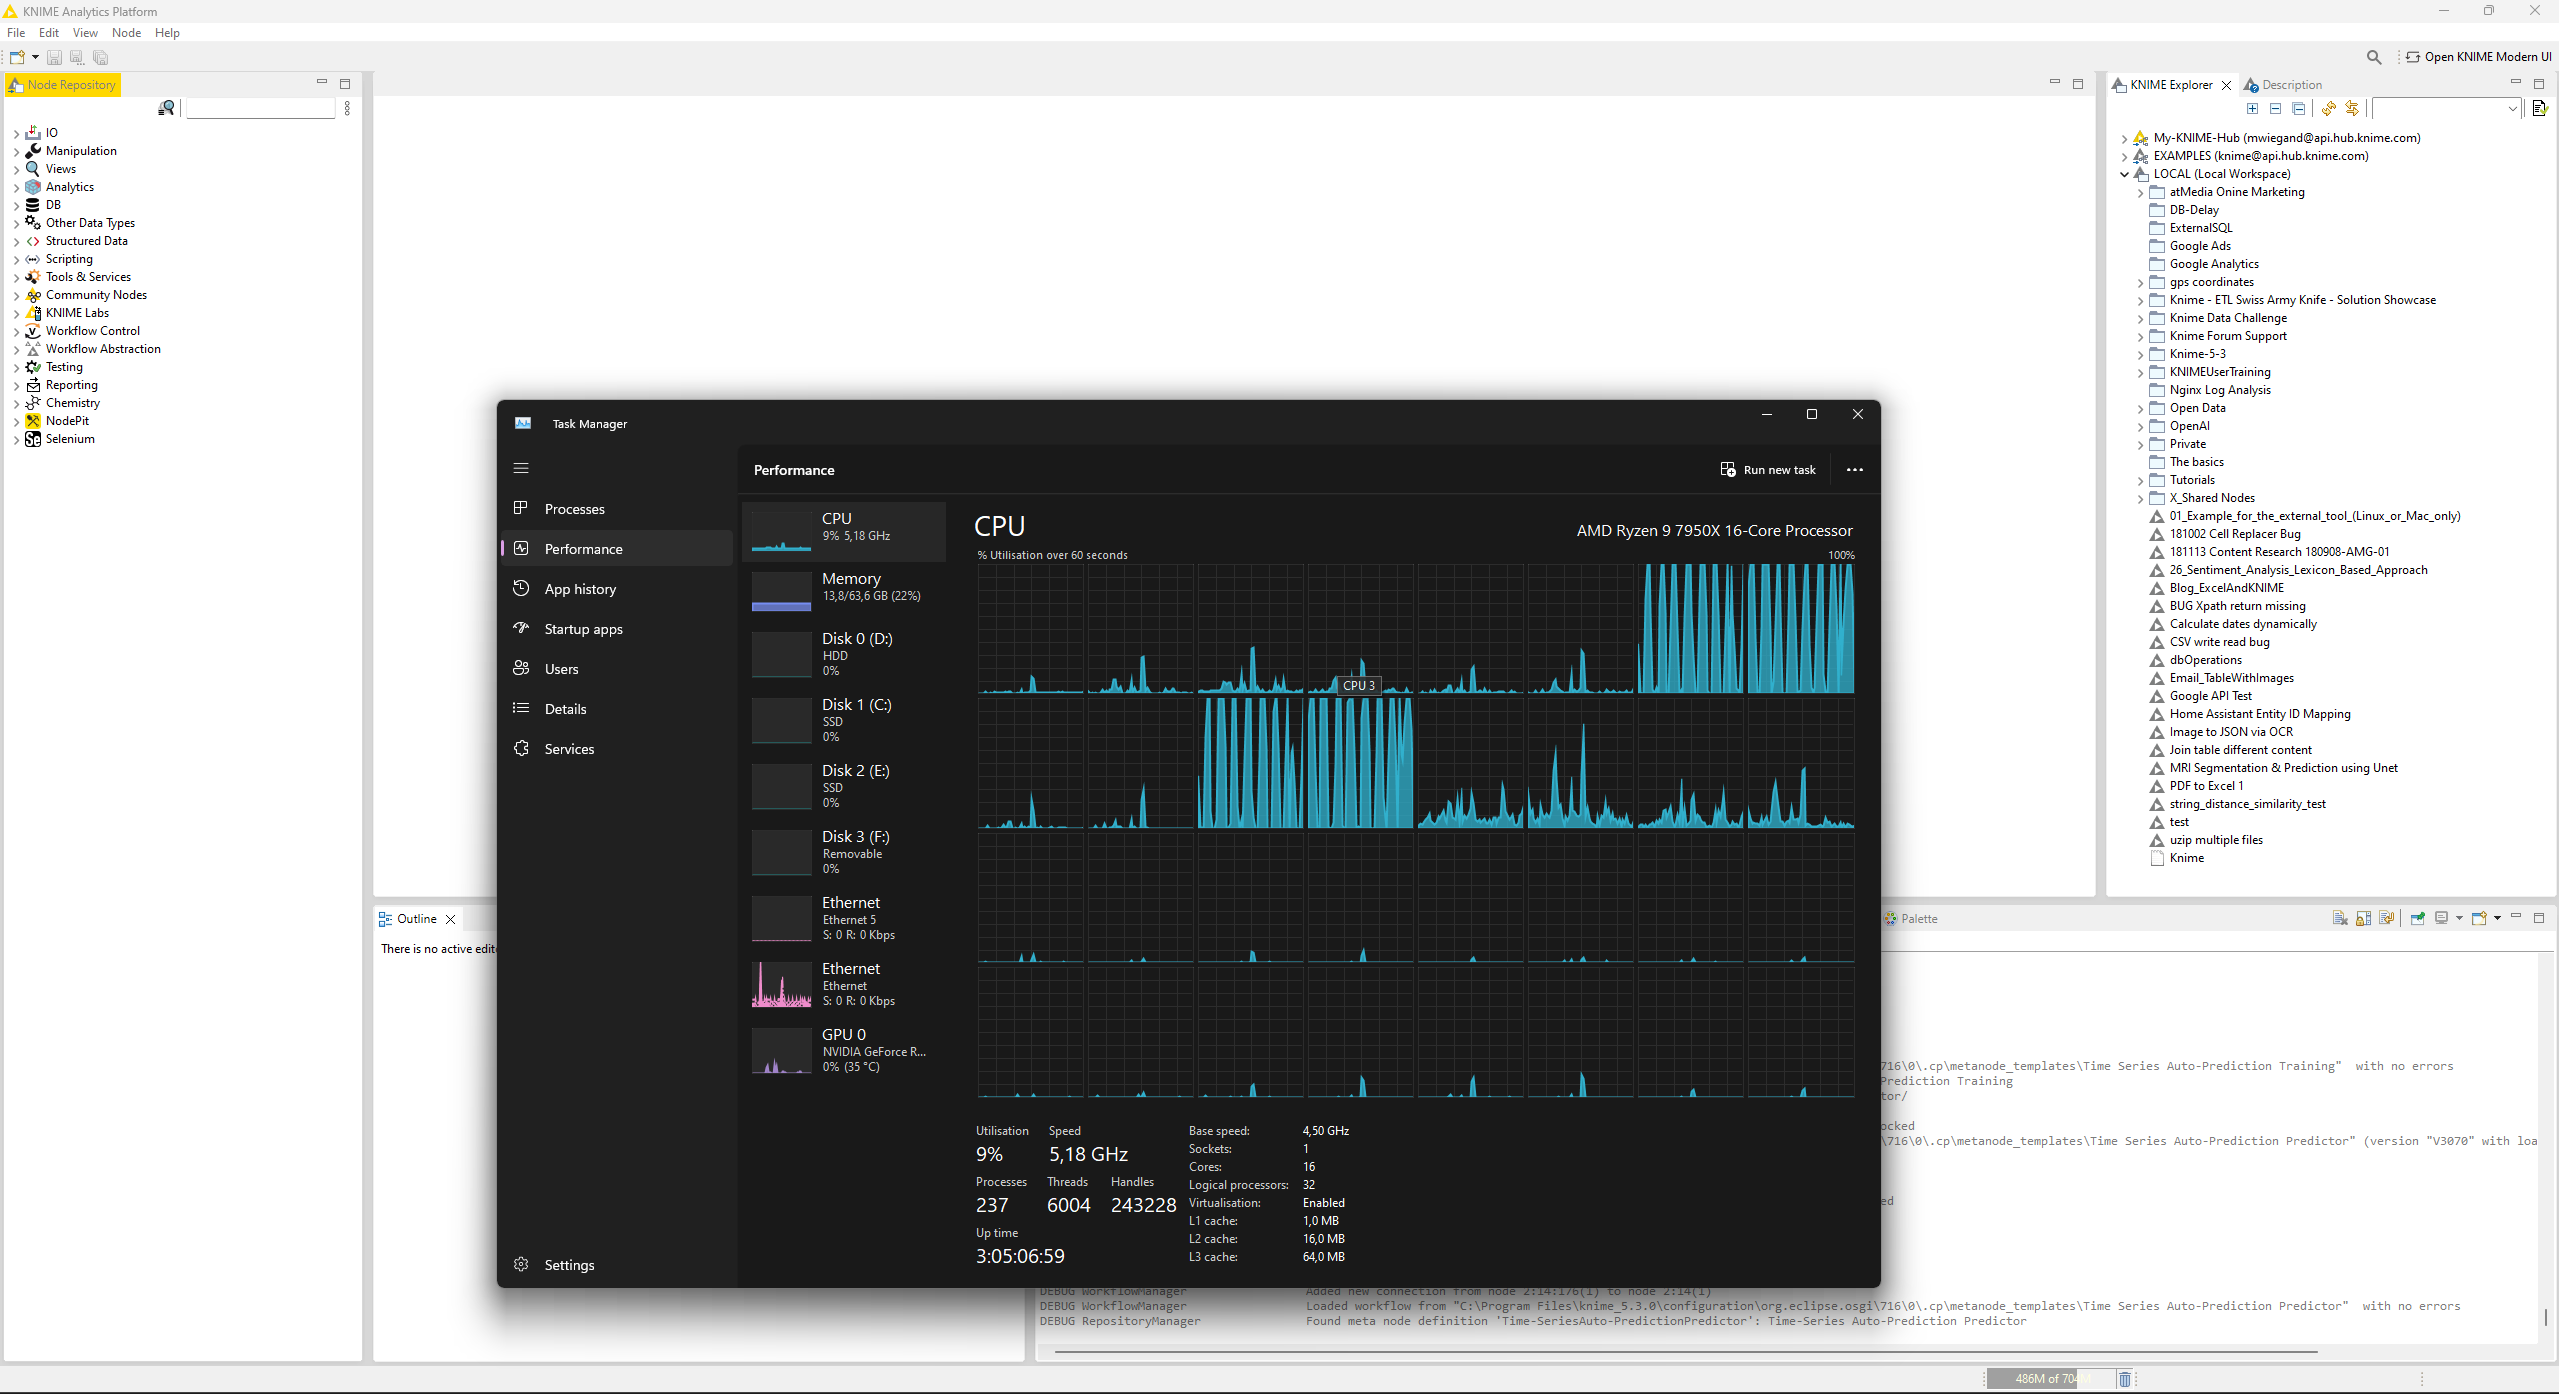
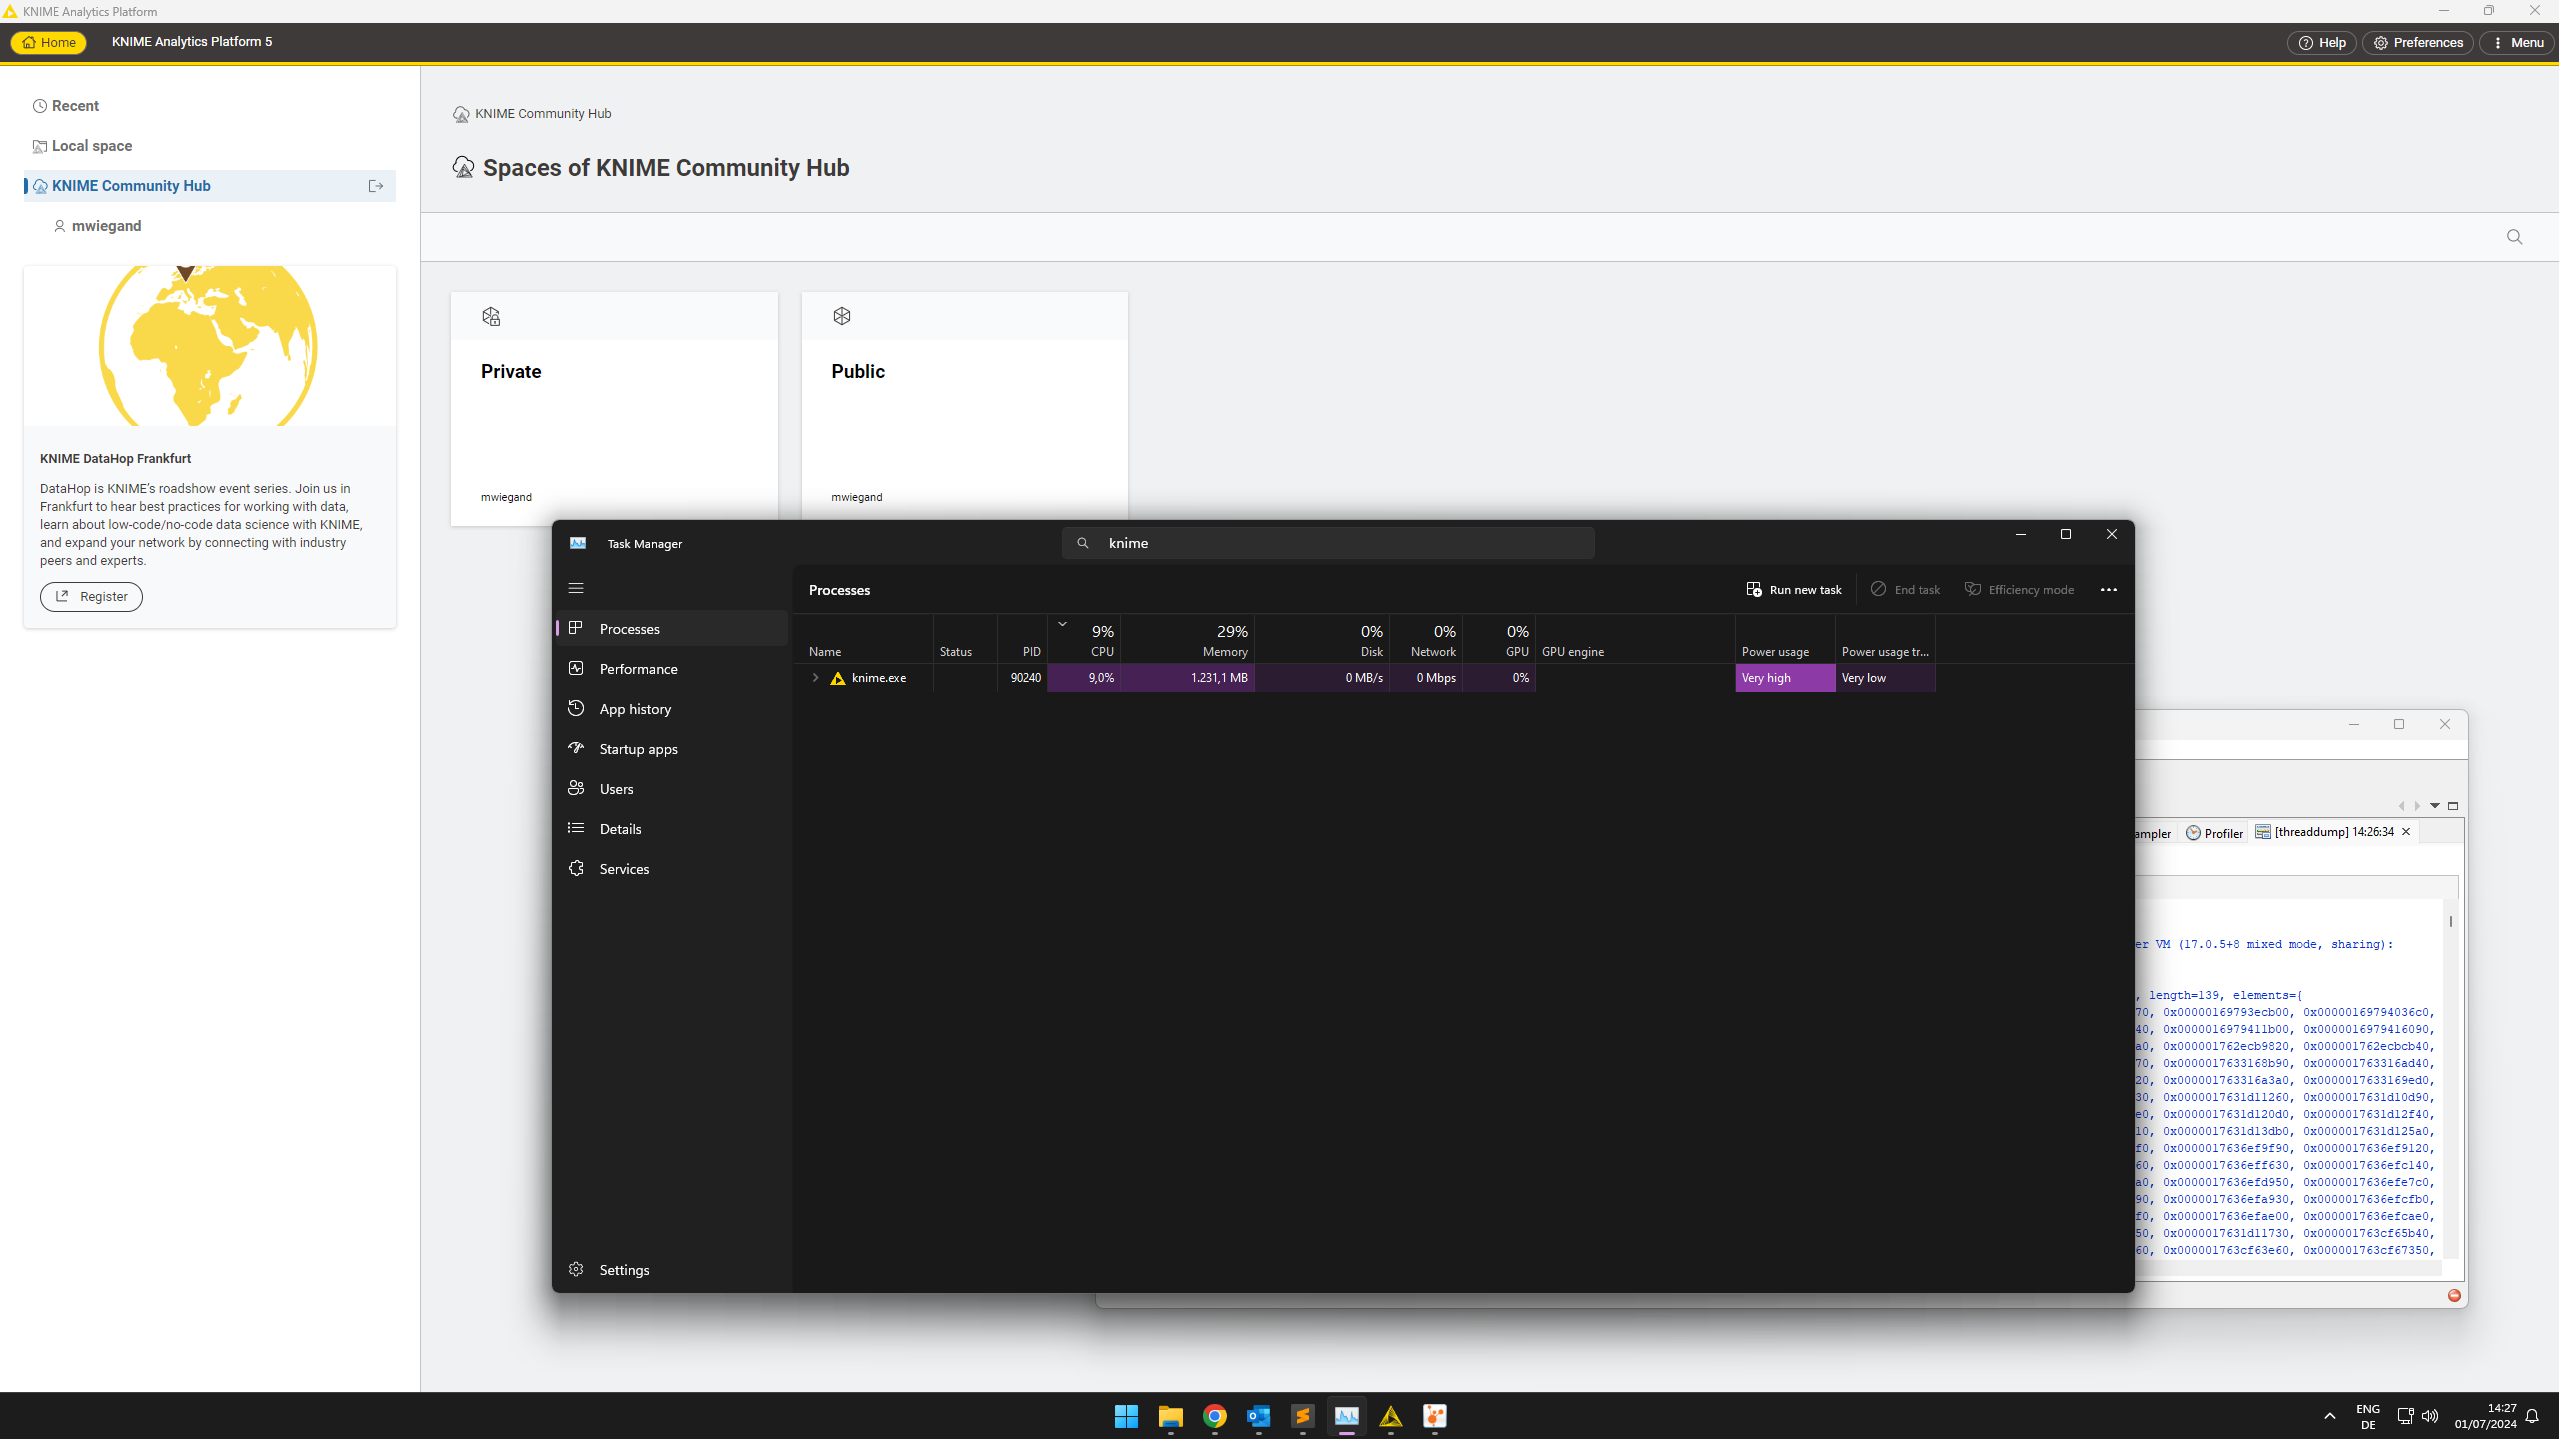
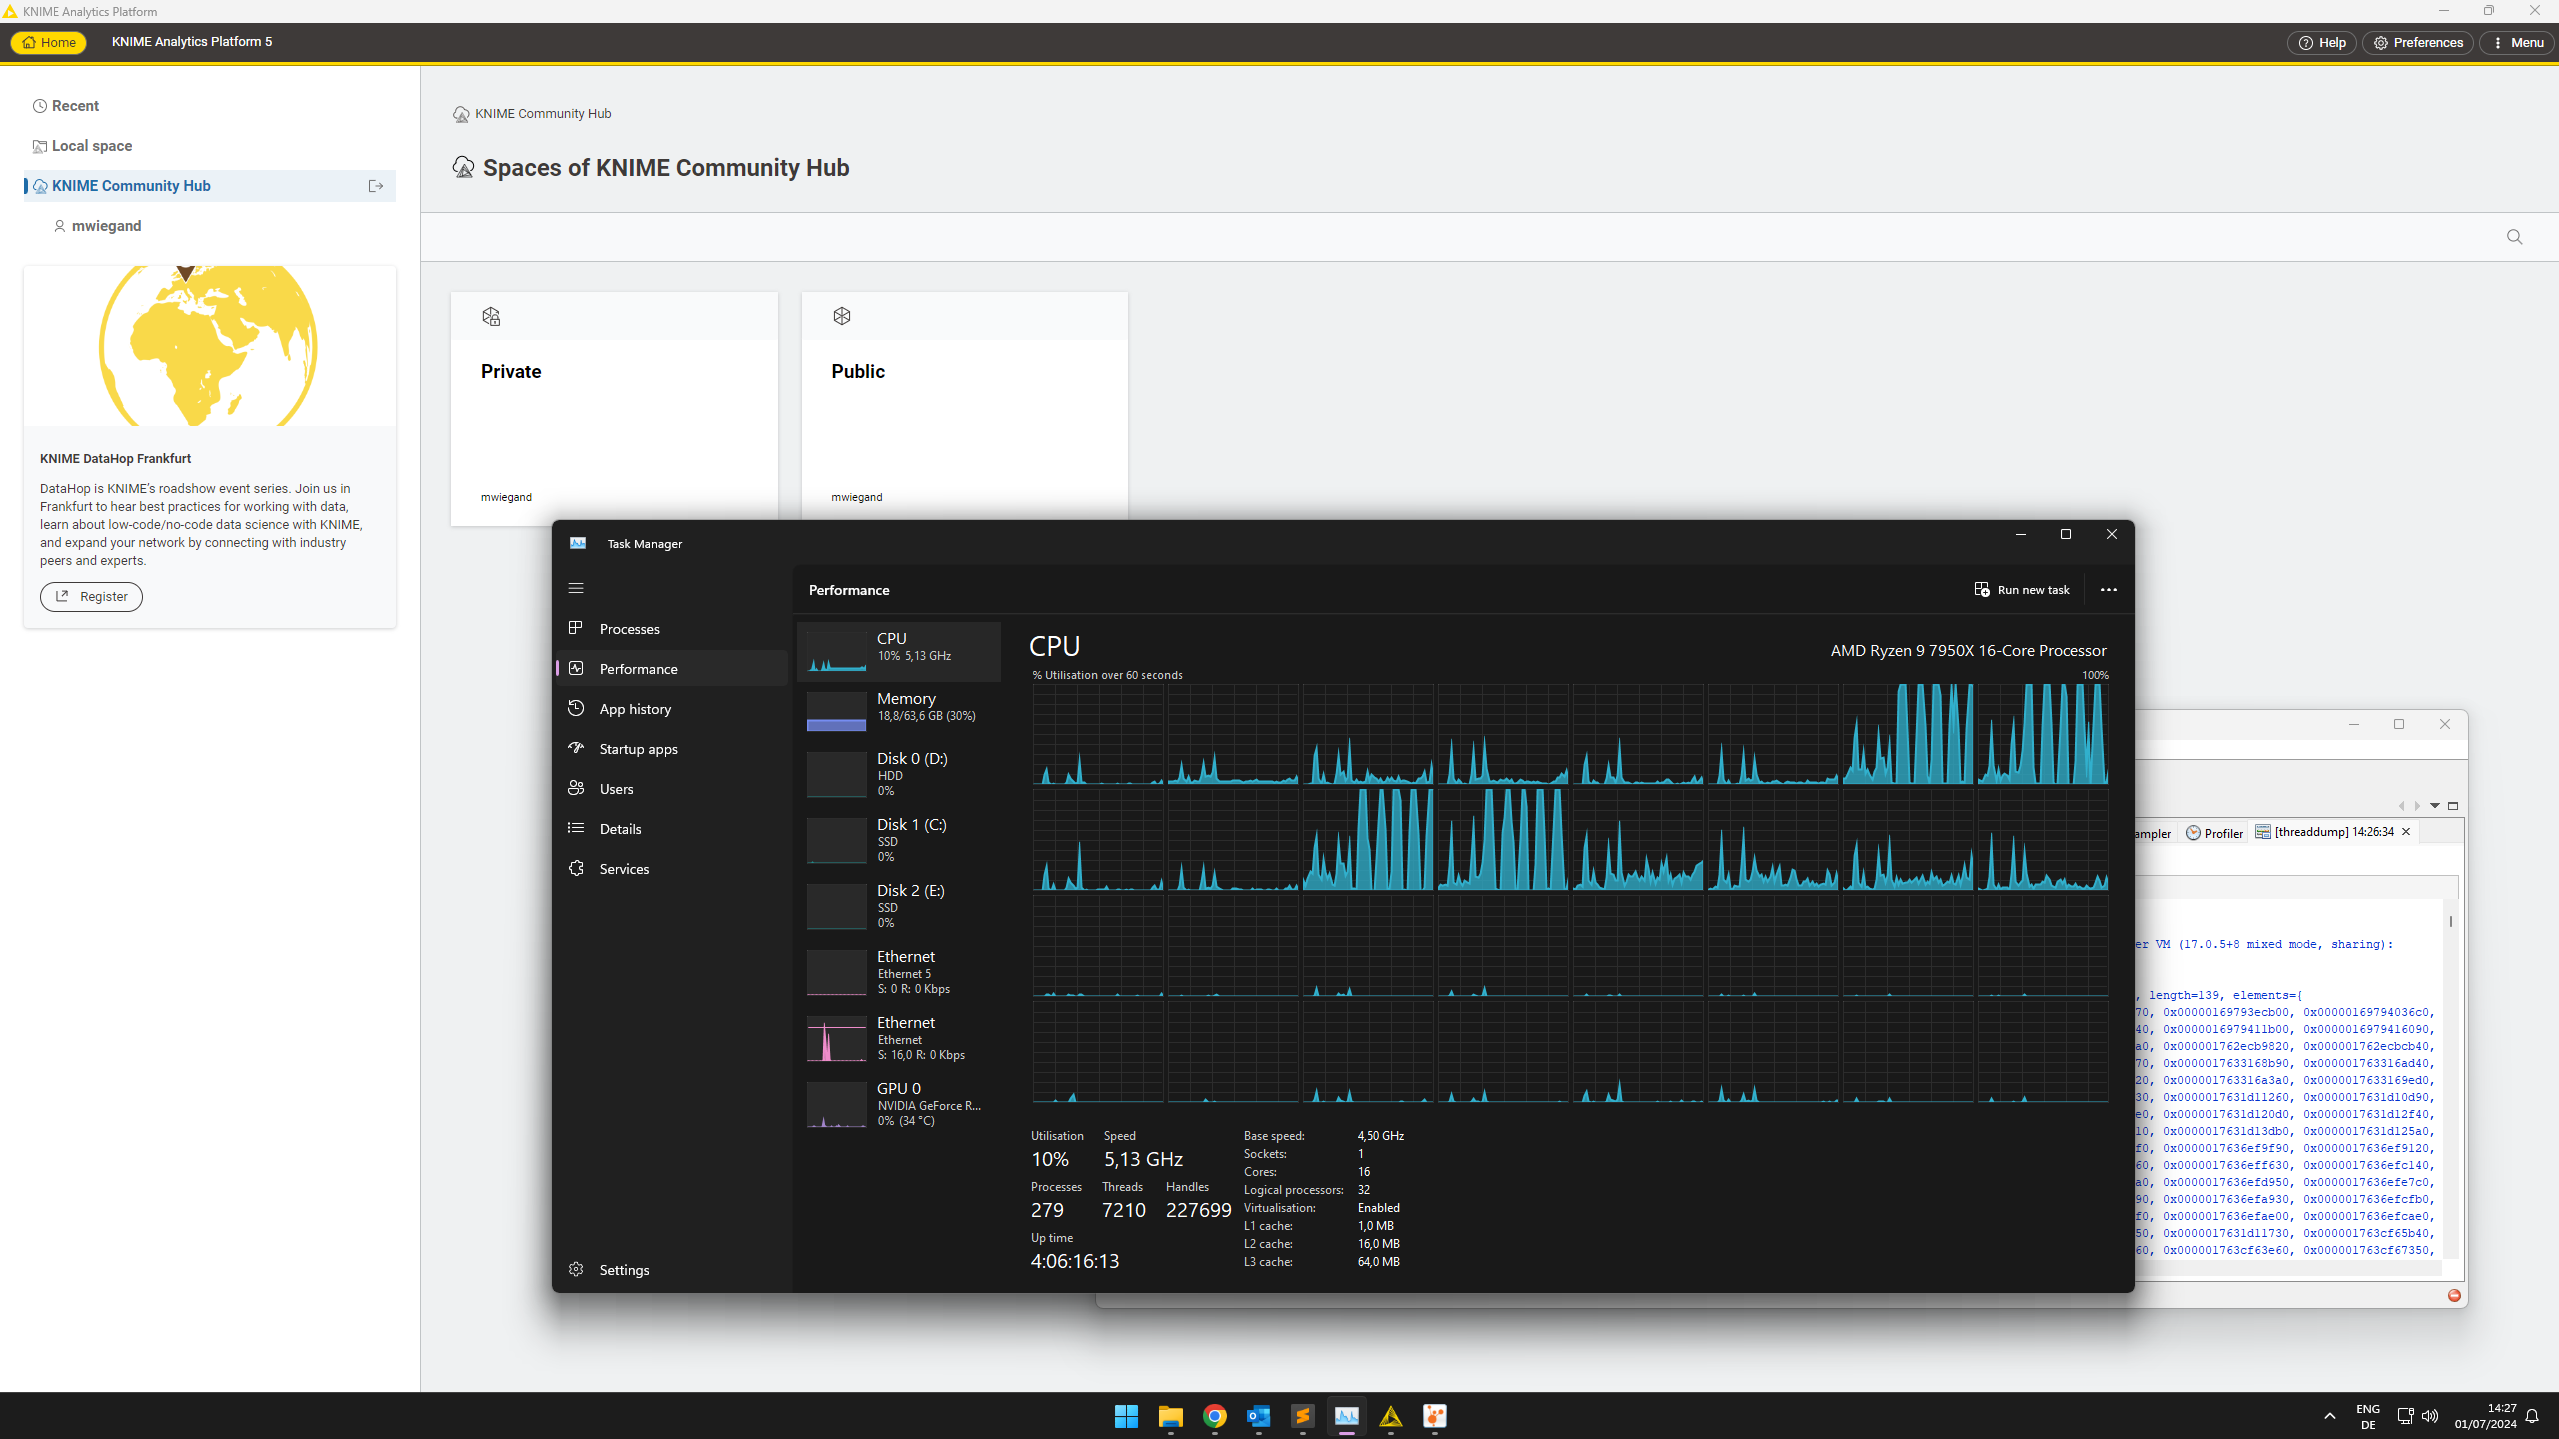
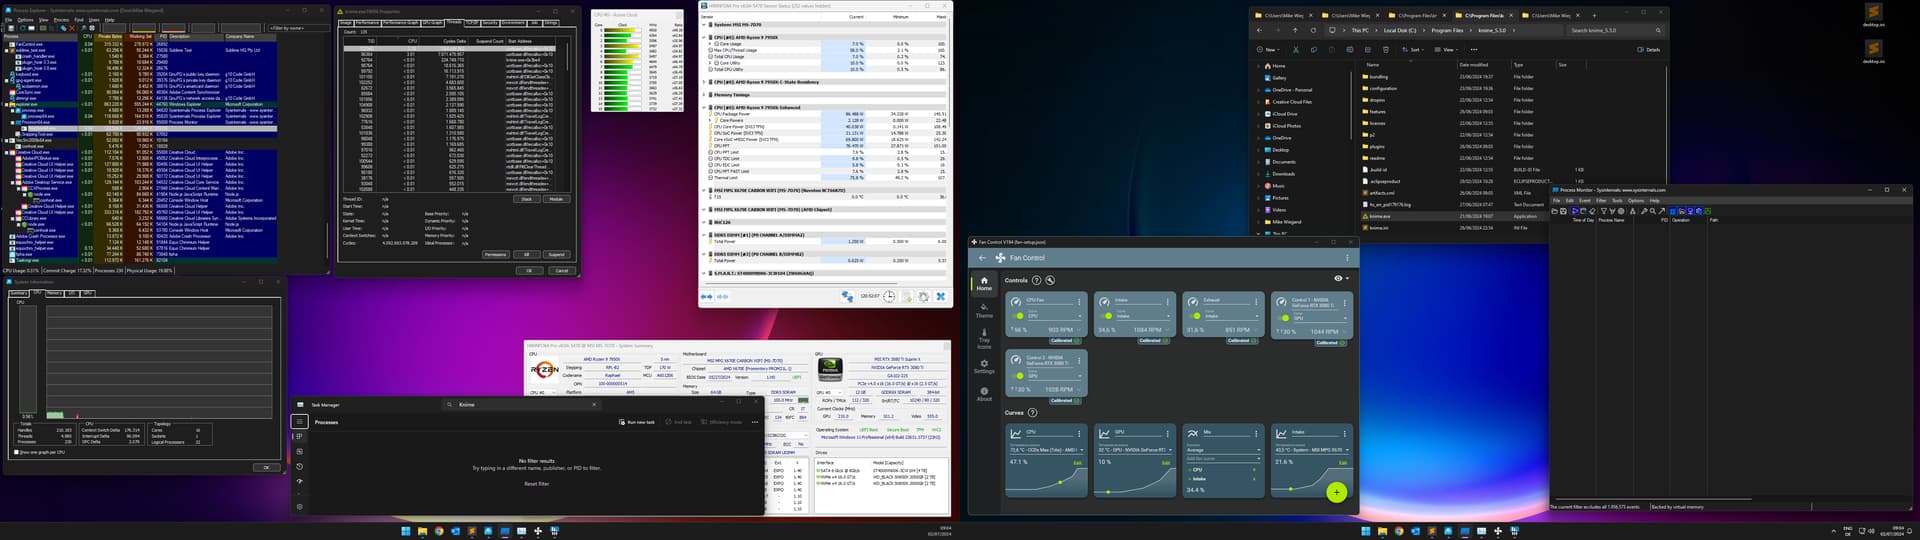
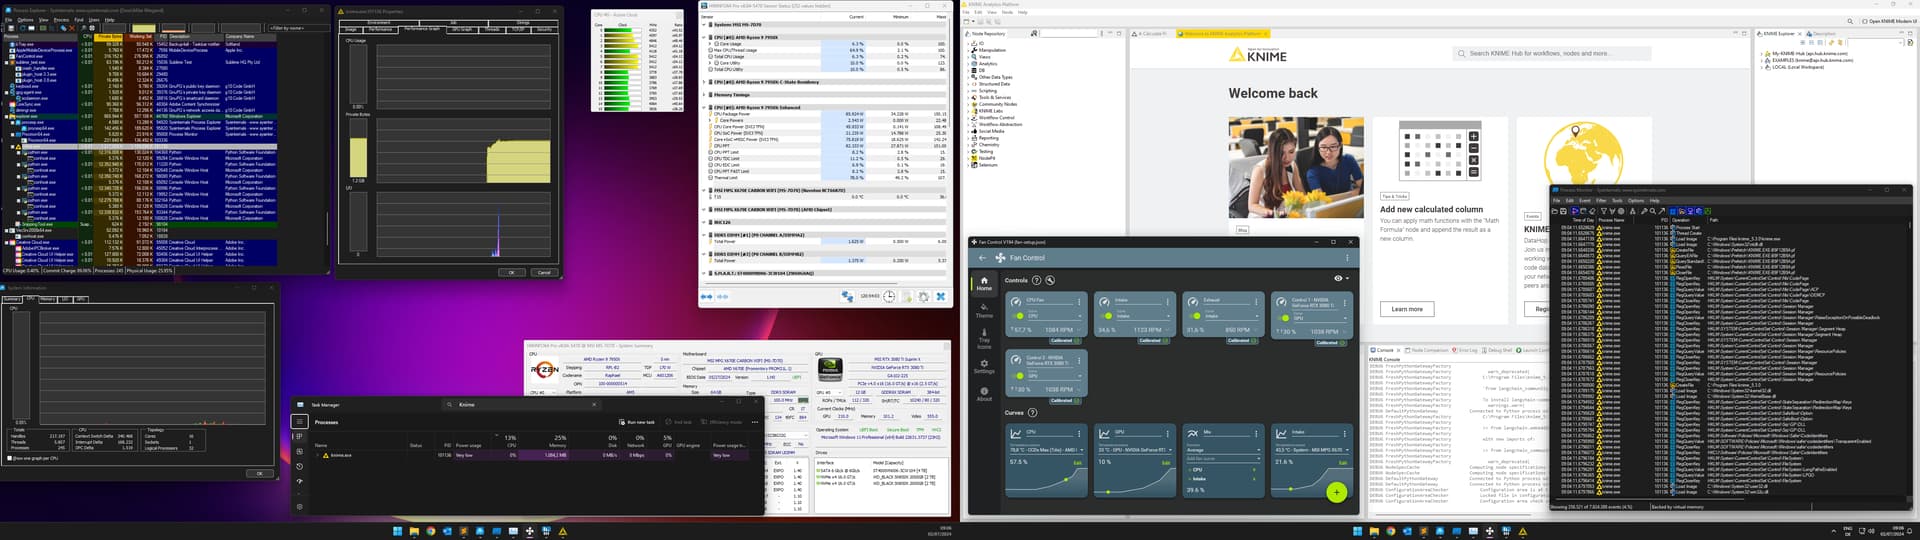
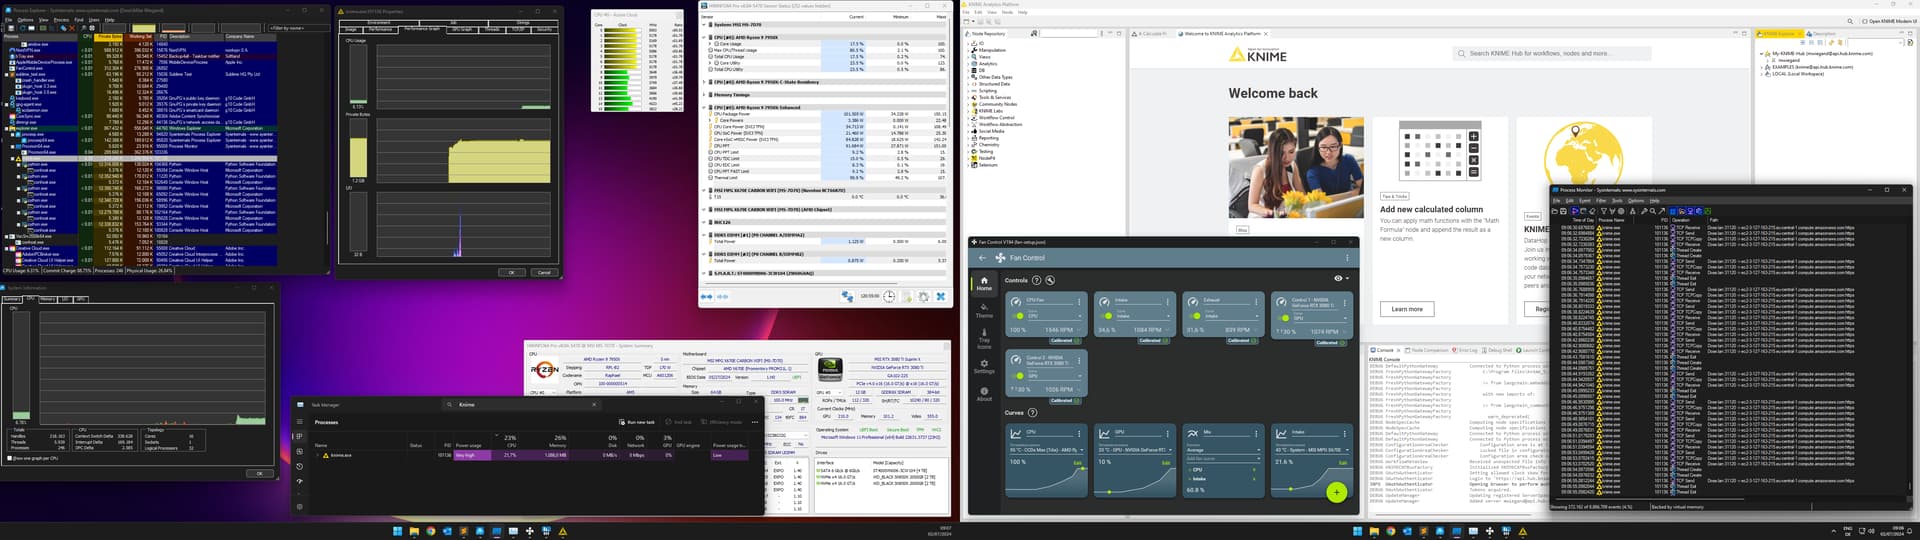
EXCEPTION: Knime connected to Hub, nothing opened
- CPU utilization up to 22 %
- Wattage increase of +15 W (Task Manager reports high power usage)
- Temps increase by 20 °C to max. of 95°C causing fan speed to ramp up (see Fan Control)
- Only a few packages send in the background (see process monitor)
- HWInfo and Task Manager both report similar core usage (polling rate differs)
- Process Explorer sees constant CPU utilization (not split by cores or threads) of circa 7%
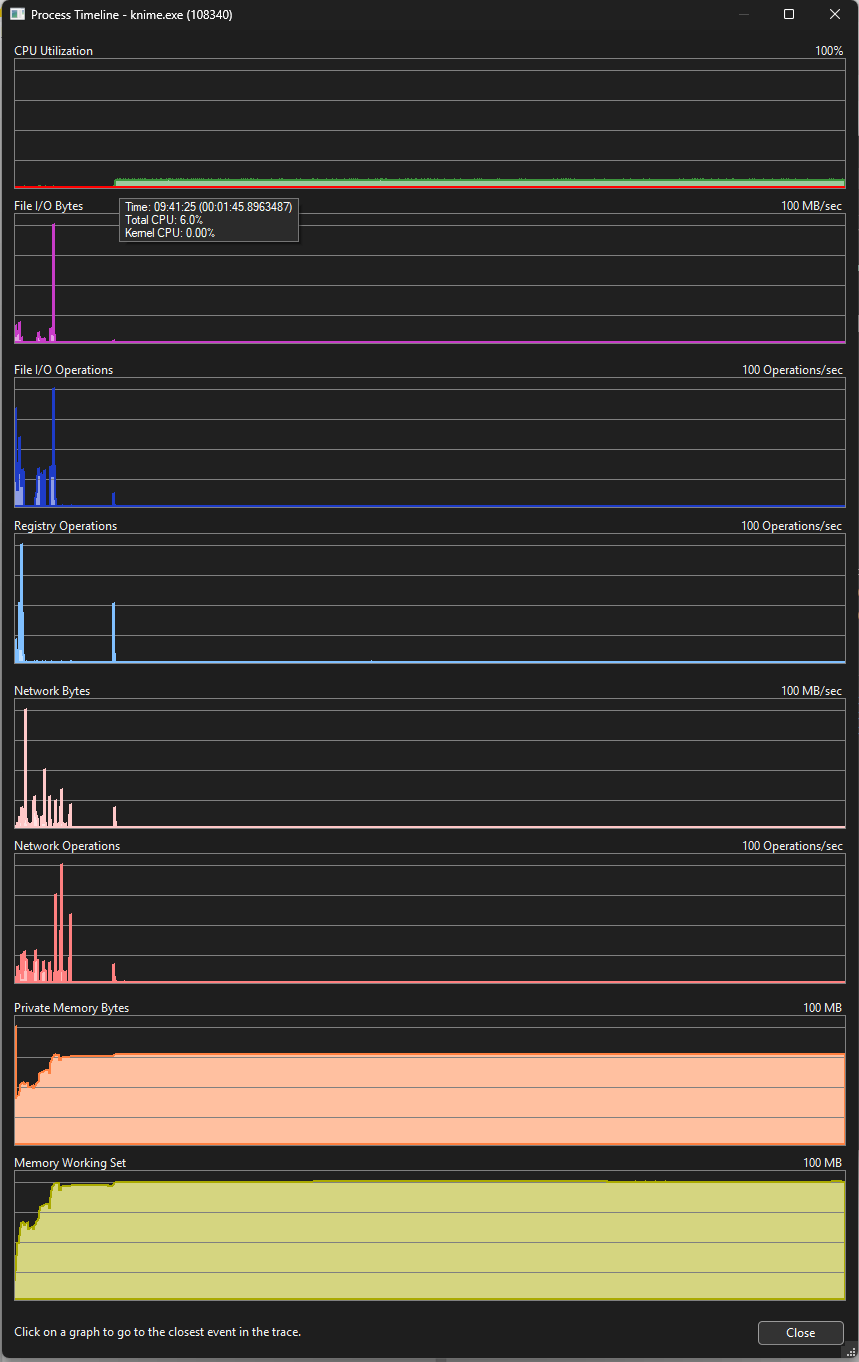
There doesn’t seems to be much IOPS not Network throughout. Hence, the issue seems to be local. Here is the process summary from the Process Monitor.
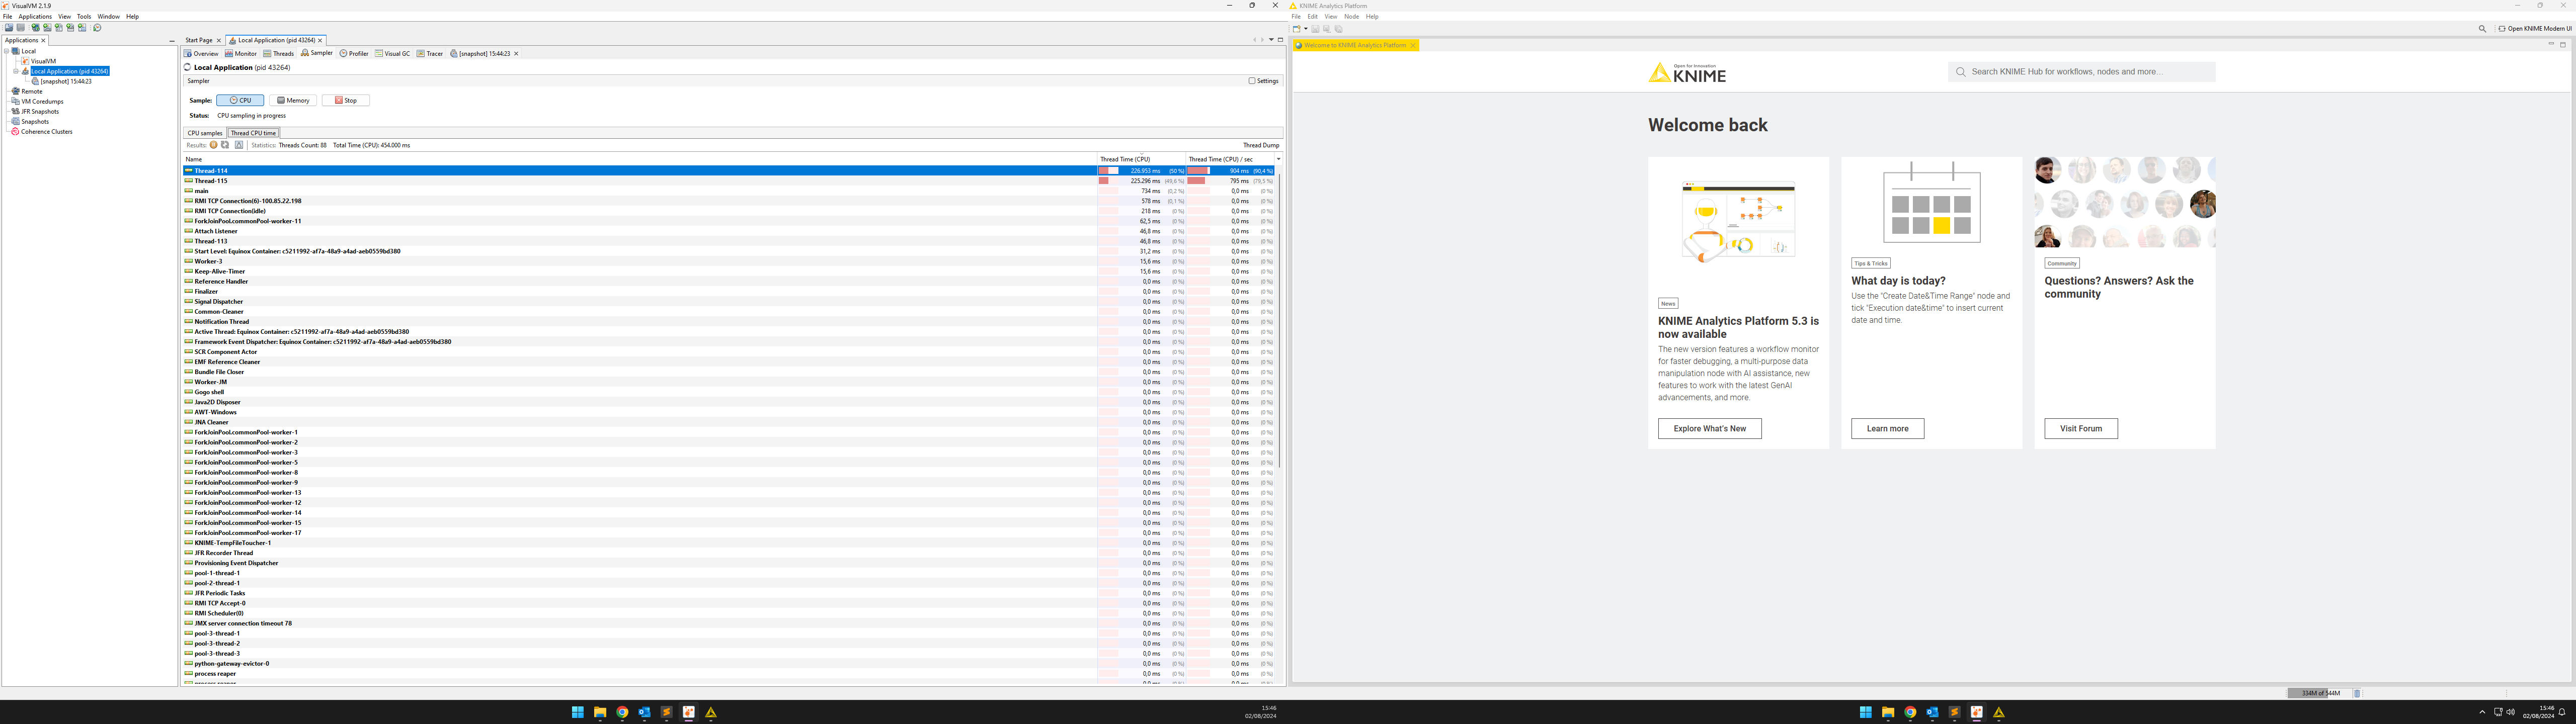
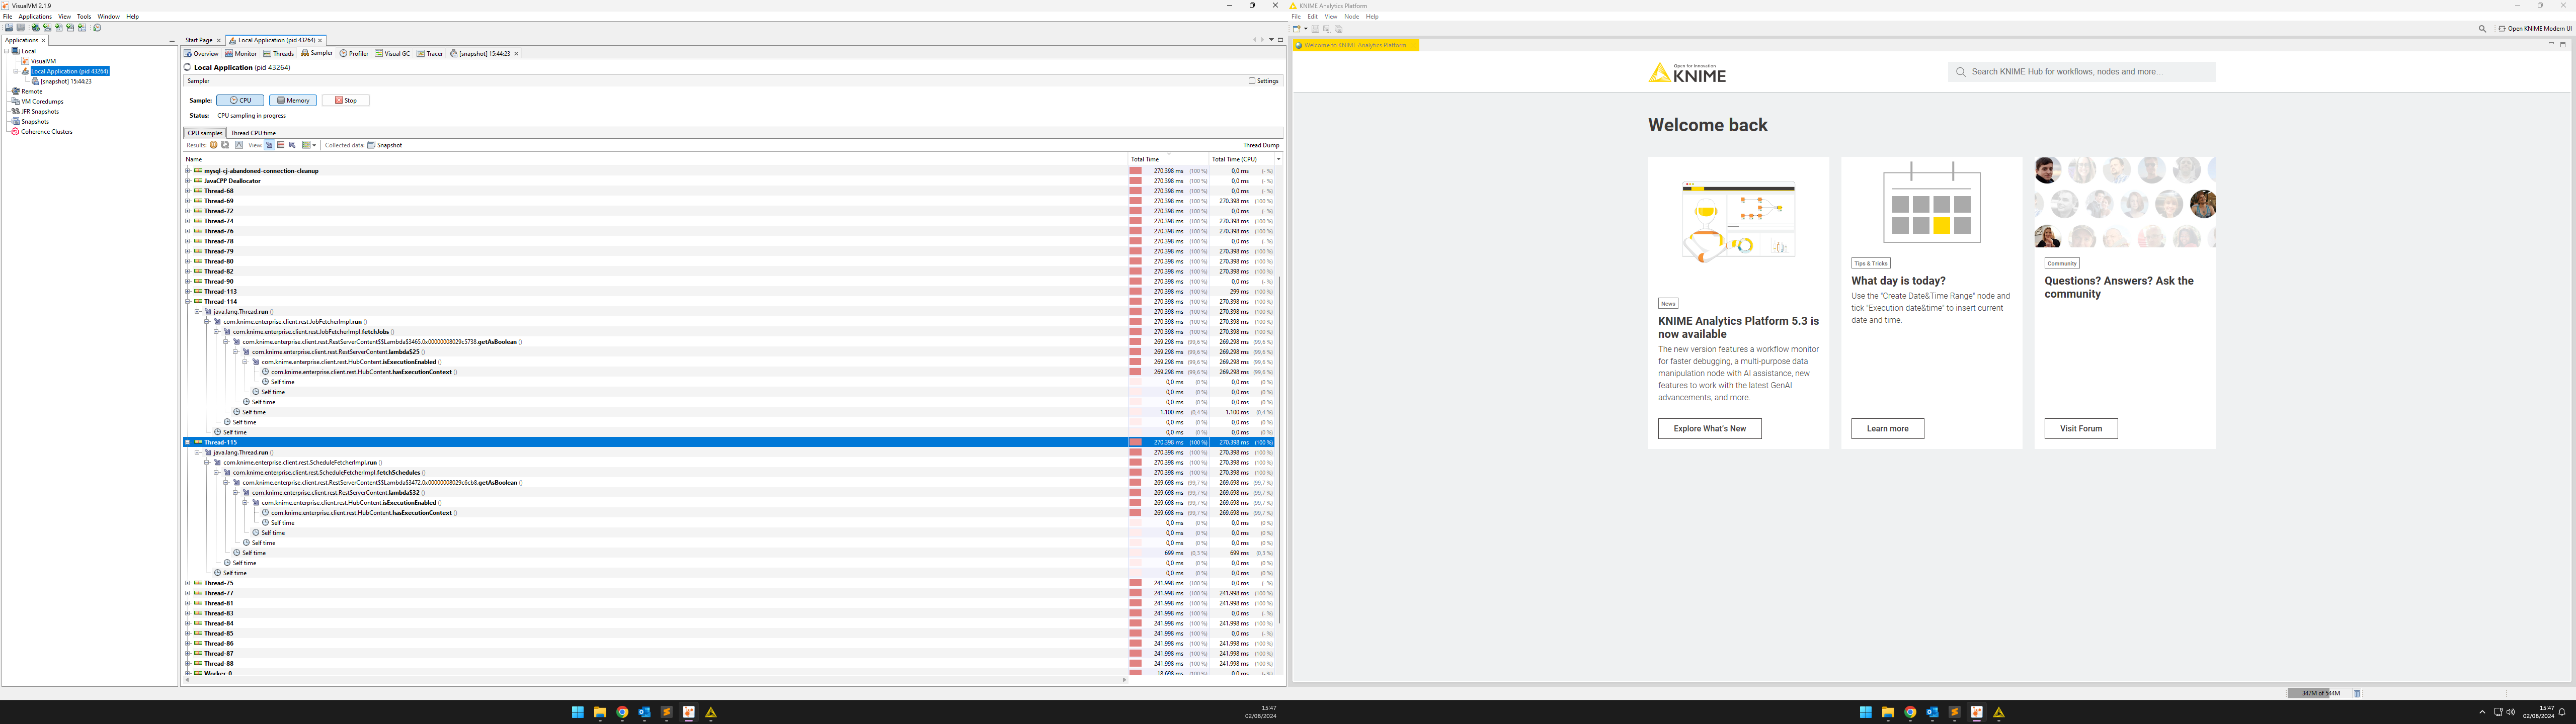
That leads me to analyzing the threads of the knime.exe PID process.
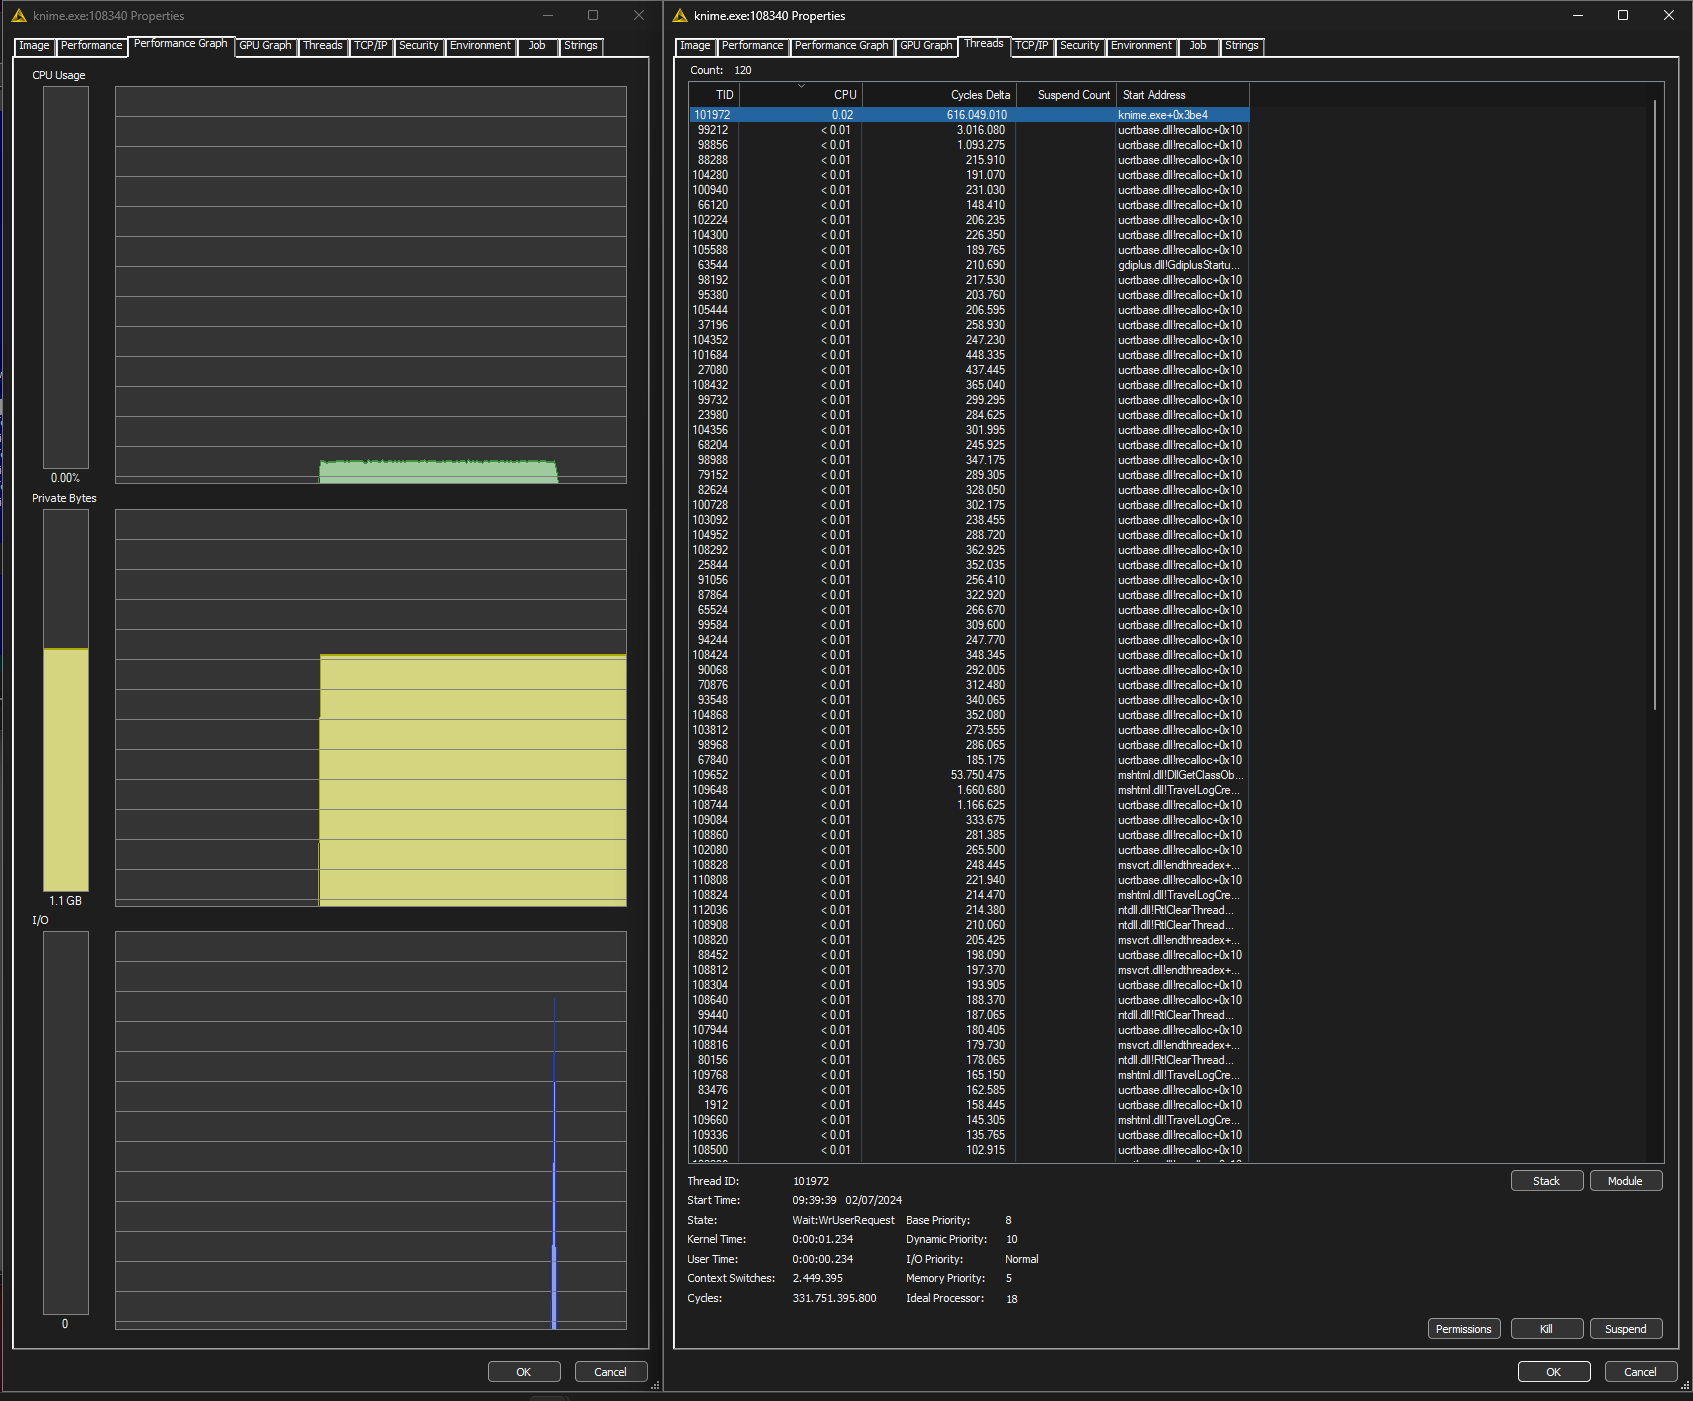
BASELINE: HUB Disconnected
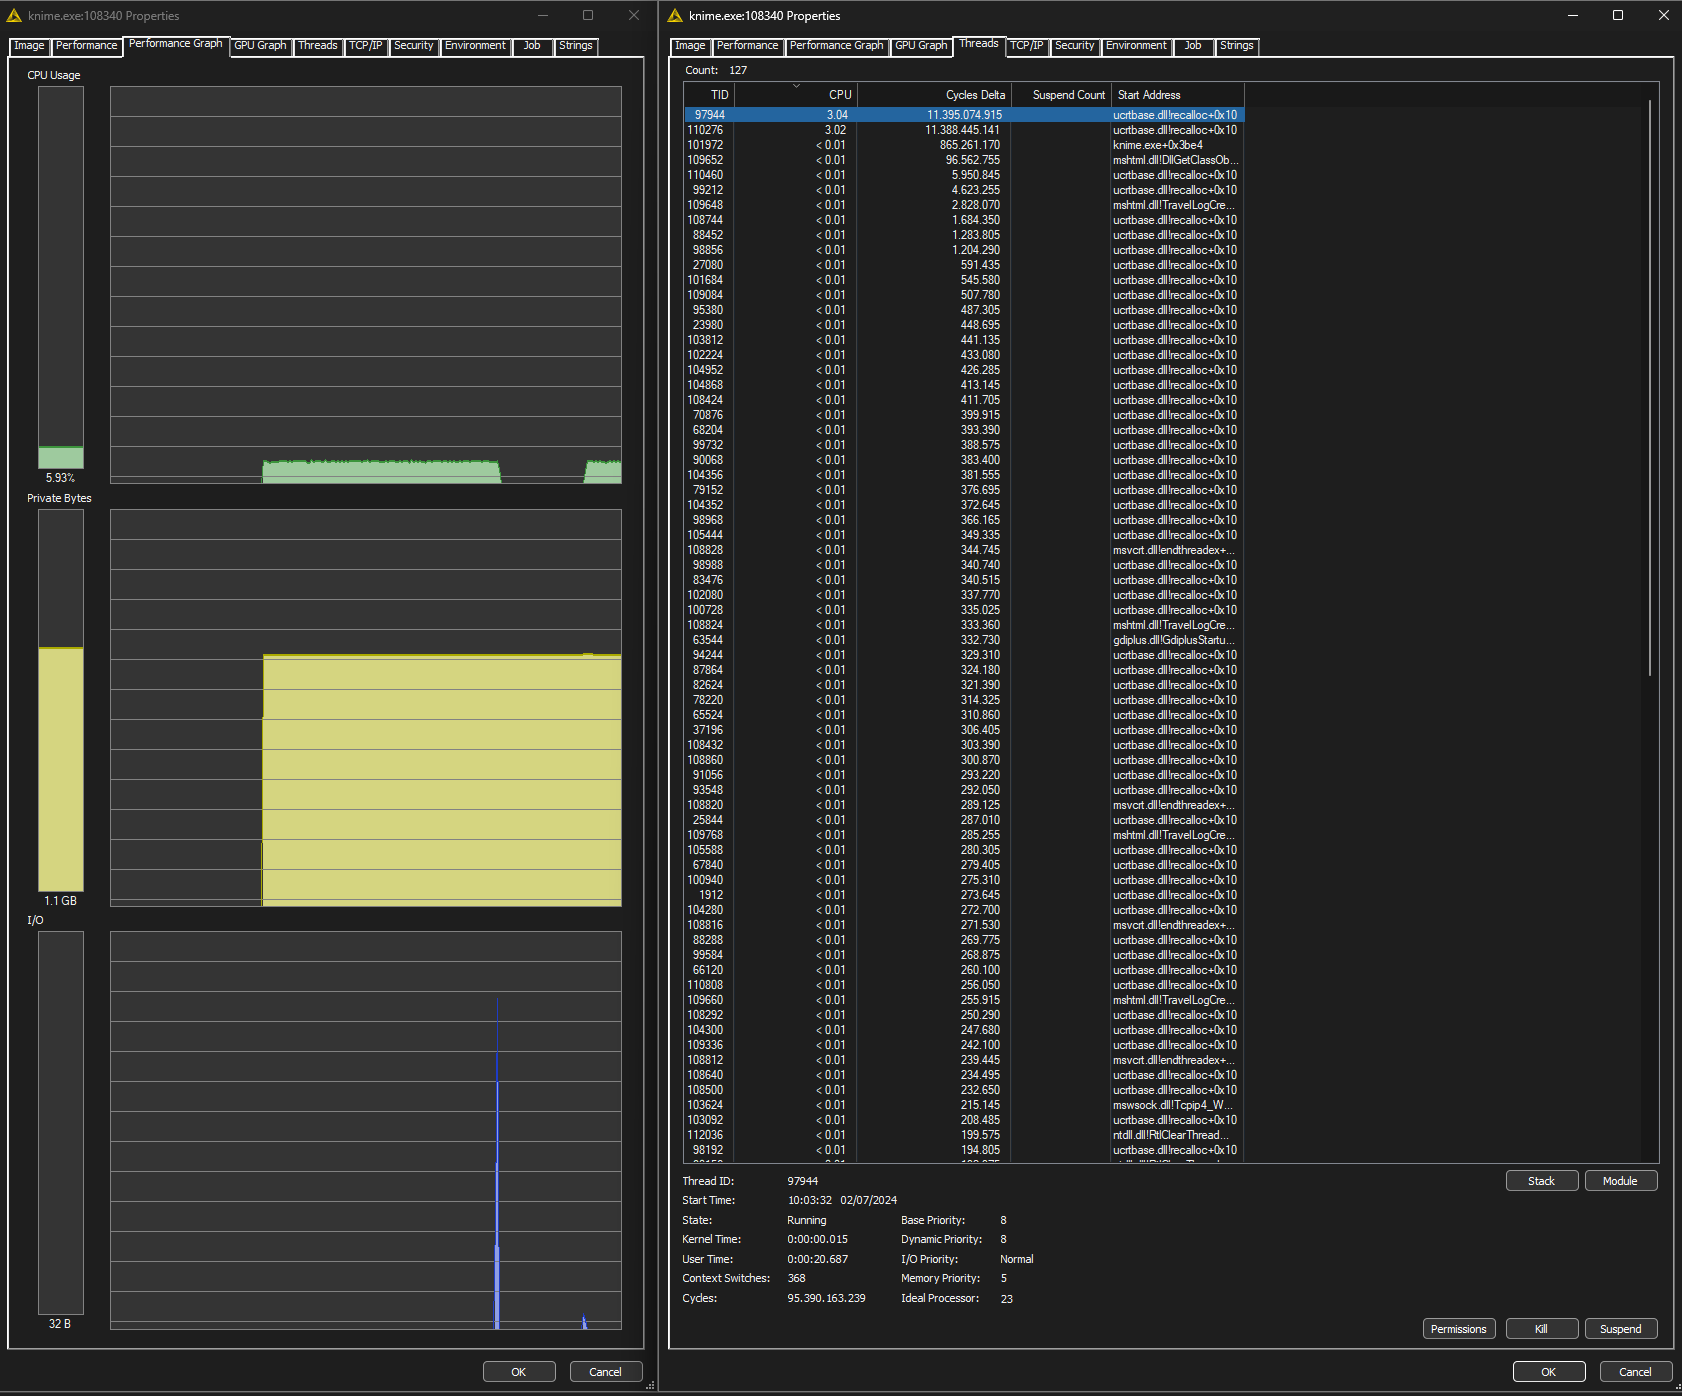
EXCEPTION: HUB Connected
Upon connecting to the HUB there are two threads with the start address “ucrtbase.dll!recalloc+0x10”
I am currently trying to work myself through WinDbg but Knime crashed likely because I unintentionally interrupted the process.
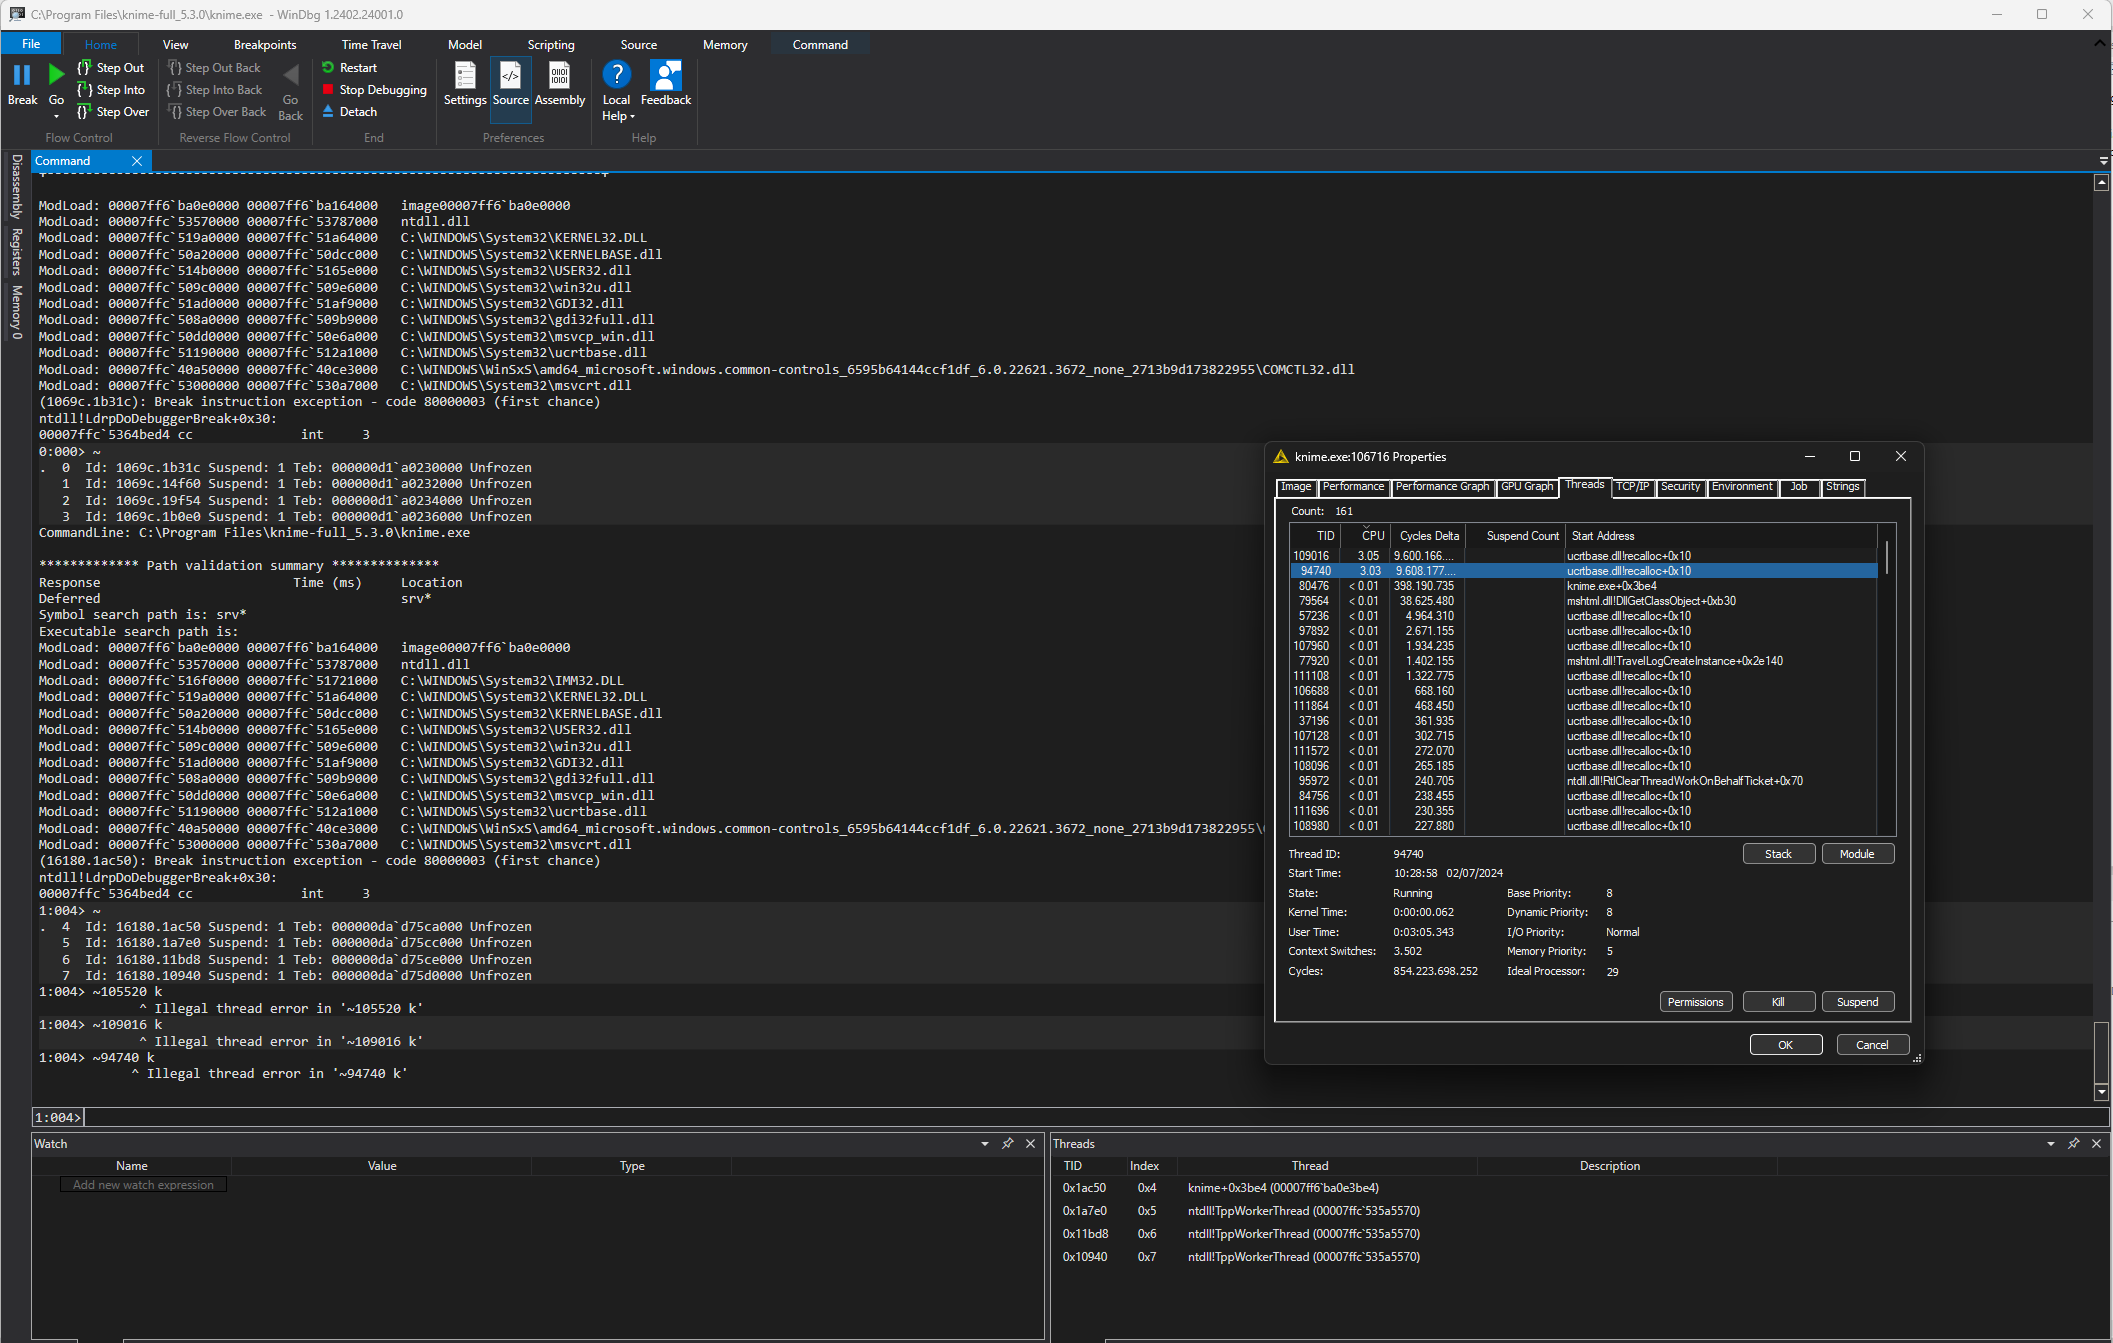
Update
Trying to use WinDbg, either by attaching it to a running process or using “File > Launch Executable”, fails. Attaching it to a process causes Knime to crash and and launching an executable fails.
WinDbg Output:
************* Preparing the environment for Debugger Extensions Gallery repositories **************
   ExtensionRepository : Implicit
   UseExperimentalFeatureForNugetShare : true
   AllowNugetExeUpdate : true
   NonInteractiveNuget : true
   AllowNugetMSCredentialProviderInstall : true
   AllowParallelInitializationOfLocalRepositories : true

   EnableRedirectToV8JsProvider : false

   -- Configuring repositories
      ----> Repository : LocalInstalled, Enabled: true
      ----> Repository : UserExtensions, Enabled: true

>>>>>>>>>>>>> Preparing the environment for Debugger Extensions Gallery repositories completed, duration 0.000 seconds

************* Waiting for Debugger Extensions Gallery to Initialize **************

>>>>>>>>>>>>> Waiting for Debugger Extensions Gallery to Initialize completed, duration 0.032 seconds
   ----> Repository : UserExtensions, Enabled: true, Packages count: 0
   ----> Repository : LocalInstalled, Enabled: true, Packages count: 41

Microsoft (R) Windows Debugger Version 10.0.27553.1004 AMD64
Copyright (c) Microsoft Corporation. All rights reserved.

CommandLine: C:\Program Files\knime-full_5.3.0\knime.exe

************* Path validation summary **************
Response                         Time (ms)     Location
Deferred                                       srv*
Symbol search path is: srv*
Executable search path is:

+------------------------------------------------------------------------+
| This target supports Hardware-enforced Stack Protection. A HW based    |
| "Shadow Stack" may be available to assist in debugging and analysis.   |
| See aka.ms/userhsp for more info.                                      |
|                                                                        |
| dps @ssp                                                               |
|                                                                        |
+------------------------------------------------------------------------+

ModLoad: 00007ff6`ba0e0000 00007ff6`ba164000   image00007ff6`ba0e0000
ModLoad: 00007ffc`53570000 00007ffc`53787000   ntdll.dll
ModLoad: 00007ffc`519a0000 00007ffc`51a64000   C:\WINDOWS\System32\KERNEL32.DLL
ModLoad: 00007ffc`50a20000 00007ffc`50dcc000   C:\WINDOWS\System32\KERNELBASE.dll
ModLoad: 00007ffc`514b0000 00007ffc`5165e000   C:\WINDOWS\System32\USER32.dll
ModLoad: 00007ffc`509c0000 00007ffc`509e6000   C:\WINDOWS\System32\win32u.dll
ModLoad: 00007ffc`51ad0000 00007ffc`51af9000   C:\WINDOWS\System32\GDI32.dll
ModLoad: 00007ffc`508a0000 00007ffc`509b9000   C:\WINDOWS\System32\gdi32full.dll
ModLoad: 00007ffc`50dd0000 00007ffc`50e6a000   C:\WINDOWS\System32\msvcp_win.dll
ModLoad: 00007ffc`51190000 00007ffc`512a1000   C:\WINDOWS\System32\ucrtbase.dll
ModLoad: 00007ffc`40a50000 00007ffc`40ce3000   C:\WINDOWS\WinSxS\amd64_microsoft.windows.common-controls_6595b64144ccf1df_6.0.22621.3672_none_2713b9d173822955\COMCTL32.dll
ModLoad: 00007ffc`53000000 00007ffc`530a7000   C:\WINDOWS\System32\msvcrt.dll
(15ed0.645c): Break instruction exception - code 80000003 (first chance)
ntdll!LdrpDoDebuggerBreak+0x30:
00007ffc`5364bed4 cc              int     3