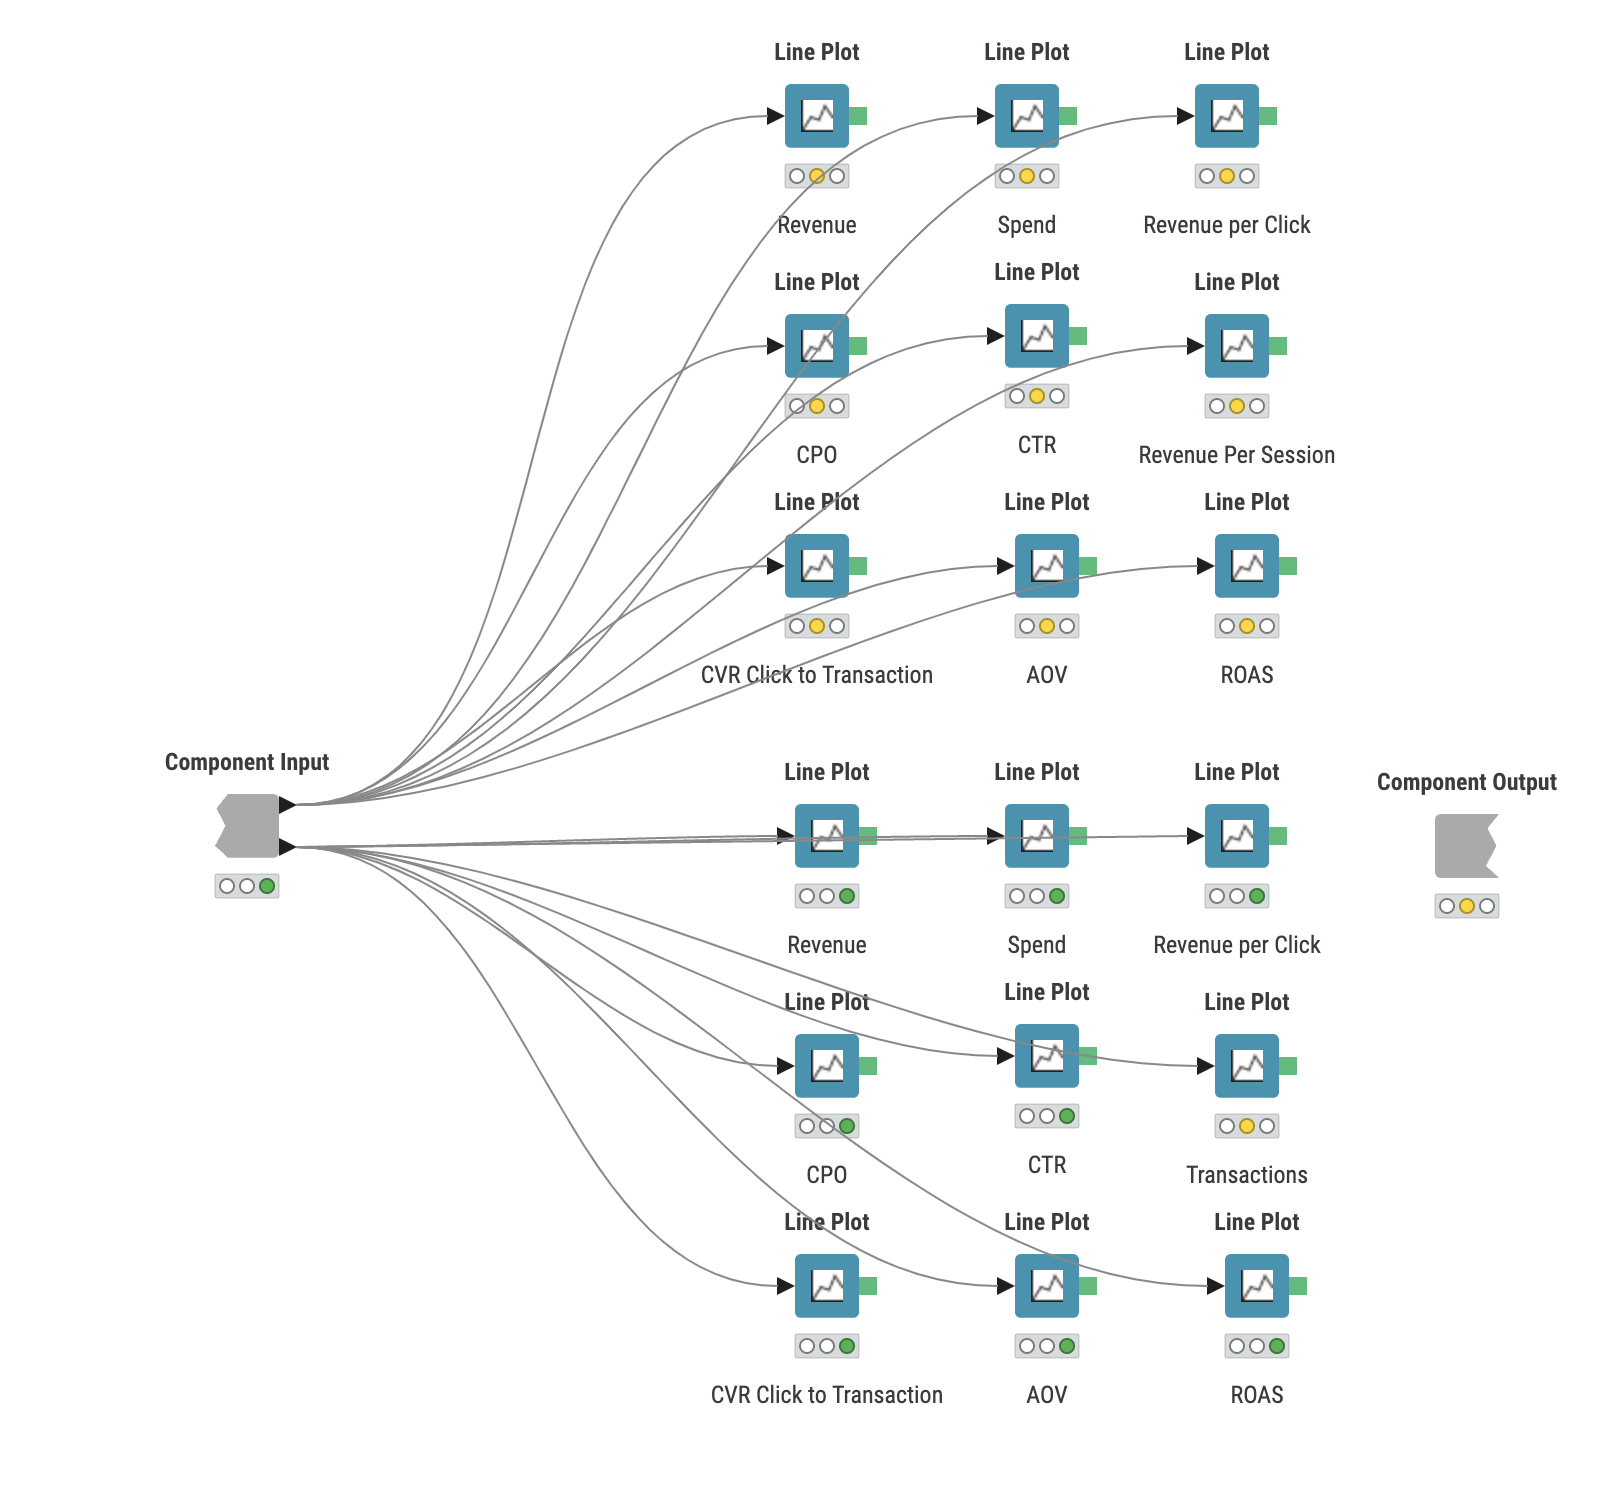
I created a workflow that will export 18 simple line charts - 9 of which are moving 7 day averages, and 9 or cumulative.
I opened the layout designer and designed my report - the question I have is, how do I add a filter so that I can filter the data? I want to be able to filter the first XX days/weeks because I’m comparing a test vs. control and the test took awhile to build, so i’d like to see the results of the full date range, and to see results of a smaller data set (filter out some dates).
Is this possible in the component/reporting?
Thank you.