Hello
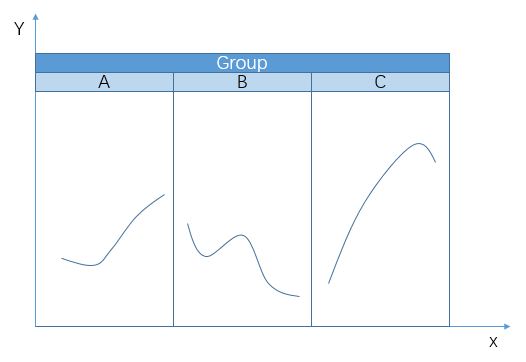
Does any one know such kind of advanced line plot node showing as below?
The key is to draw difference group data in a single chart, with the same x and y scale.
Thanks.
BR,
Zy
Hello
Does any one know such kind of advanced line plot node showing as below?
The key is to draw difference group data in a single chart, with the same x and y scale.
Thanks.
BR,
Zy
Hello @Zyw,
there’s no such node to my knowledge. Either go with Generic JavaScript View either with Python/R.
Br,
Ivan
This topic was automatically closed 182 days after the last reply. New replies are no longer allowed.