Considering you are building a report have you thought of using BIRT? It is integrated in KNIME Report Designer extension. You prepare the data you want to use in the report and then design, style and edit the presentation of this data with the report template editor. Here is more about it: https://docs.knime.com/latest/report_designer_user_guide/index.html
To prepare your data for it you use whatever node you wish or need - GroupBy, Pivoting, Math Formula…
This sure sounds promising. I will dive into this and see what I come up with. Thanks for the direction. I know I came across BIRT in my reading, but it definitely slipped through the cracks in my consideration. I appreciate it.
In case others found this thread to be as valuable as I did, I am a very visual person and found the video that supports the link you supplied. https://youtu.be/mLq6hgH9LS0
I would like to know your thoughts about how far to carry a analysis before focusing on the BIRT tool.
What I mean is it appears that raw data, without doing any aggregation or applying any pivot tables is all that is needed to use BIRT? Should we feed BIRT raw data or process the data 1st and then feed into BIRT? Where do you draw the line? Thanks for any feedback…
I am running into a challenge that I am sure there is an easy fix? I hope.
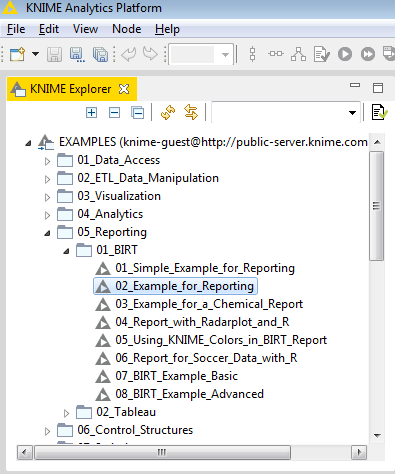
I don’t see the BIRT button to the right of the zoom field. Do I have to download an extension to get this to show up? I dropped the “Data To Report Node”, but I don’t see the BIRT Report Designer button?
Any suggestions?
you need to install it as any other extension. Then it will appear. Here is video considering you are a visual person
And here you can read a bit more about installing extensions:
Regarding your questions about processing/preparing data before BIRT or inside. For sure you will have to process some data before but I think BIRT has functions so you can do certain calculations inside as well. I guess that depends on what kind of report are you building/calculations you are performing.
What you might find useful is this blog post and workflow examples from Reporting section on KNIME EXAMPLES Server. Also all workflow searchable, accessible and downloadable from KNIME Hub.
After exhausting myself in the solution offered, I don’t see that jewel I am looking for. It may not exist. I would like to use the COL_SUM(column_name) in the Math Column Node with a Aggregate, so that the sub-totals of each Category would be calculated as sub-totals first, then I would obtain a Grand Total. Any suggestions?
Sorry, I provided a sample in the beginning of the thread which shows a aggregated structure categorized for Footer then Foundation Wall.
I should have referenced it for clarity.
Using the Column_Sum will sum the entire column of a selected column of the Dataset, but that would be the Grand Total of all categories.
I am trying to do a Sub-Total as well for each category.
Please take a look at the sample structure in the above thread from a few days ago.
From here, I am thinking BIRT can be used to produce a professional looking report, which would be easy on the eyes.
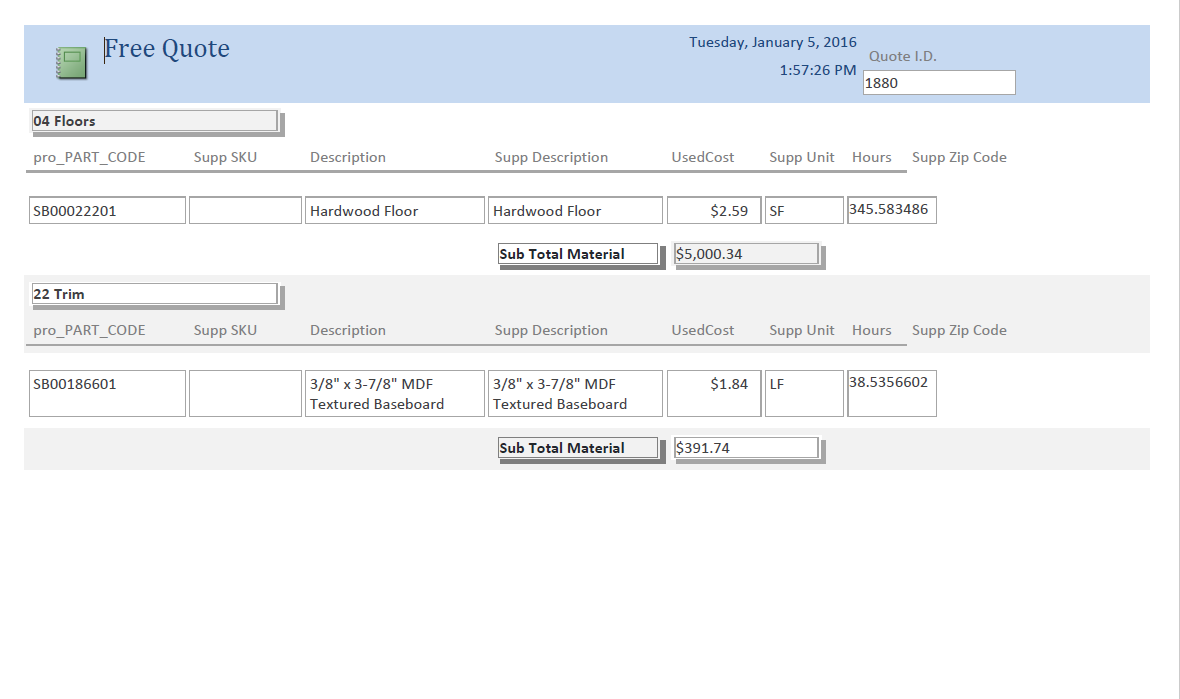
I actually got a pretty good result, however the goal I am trying to achieve is still not jumping out at me. I am attempting to produce a report in the following format.
This is the basic structure of the report. It would have additional calculations at the bottom like Grand Total for Materials and for Wages. Payroll calculations and the like. I would like to figure it out myself if you can get it started with this format provided. My calculations work fine with the Groupby and the Math nodes. I just can’t seem to produce this format for the report. Thanks for any help with how this could be done.
I am thinking that it may be easier to format a little differently, where the sub-Totals are grouped together and the aggregate Totals are together in it’s own section. A little different, but could still convey good information in a easy to read format, Your thoughts are appreciated? RAD over Reason, lol
I made that up…