Hey everyone,
I feel that the solution is right around the corner  however, I just can’t find it.
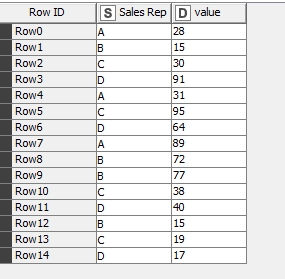
I have a table that looks like this:
I want to have something like a rolling aggregation. Something like this:
Row 0: 28 (28)
Row 1: 43 (28+15)
Row 2: 73 (28+15+30)
etc.
What I basically want to “mimic” here is finding a threshold. Where have I reached an 80% (or whatever percentage) threshold of the total values (I have a second stream in the workflow, where I calc the sum).
In Excel I would have gone by a formula like this…
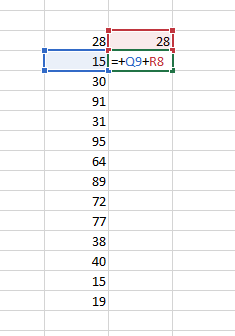
… starting in the 2nd row…
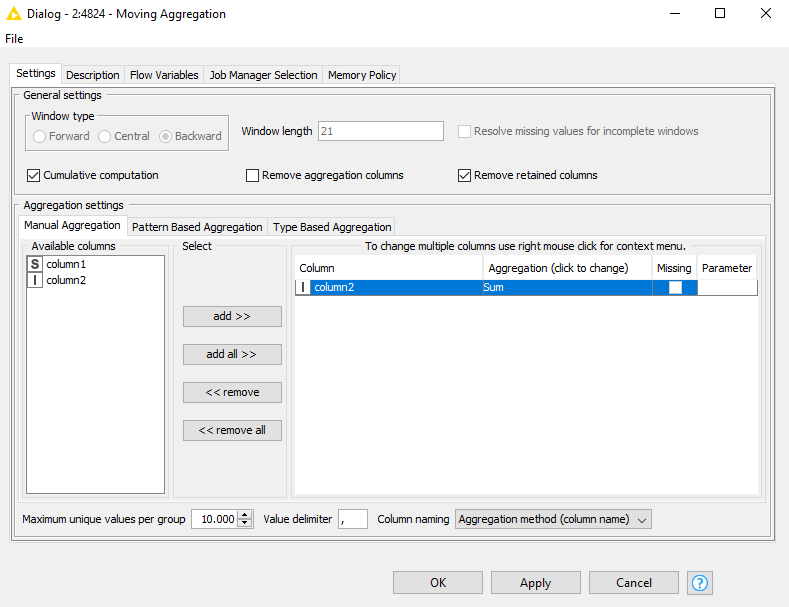
I tried moving aggregation but couldn’t get it to work and also have the problem, that the window may change dynamically, because the base table (see first picture) may be larger or smaller every month.
Thank you in advance! 
 )
)