Hi,
since updating from 5.2 to 5.3 I noticed none of the chart nodes, even the JS-based
or Plotly ones, render anything. There is no error in the console, though.
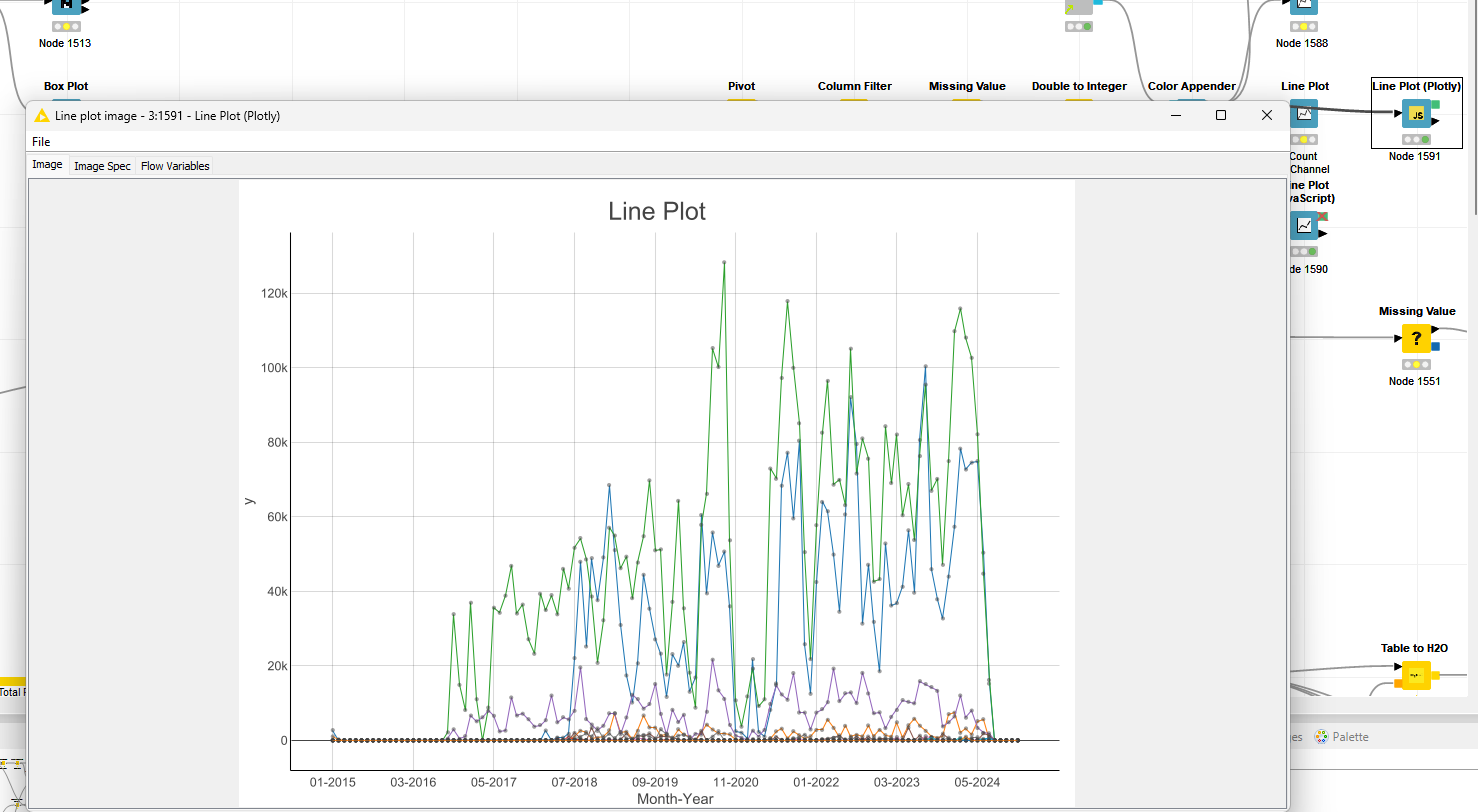
However, the image generation seems to work
Best
Mike
Hi,
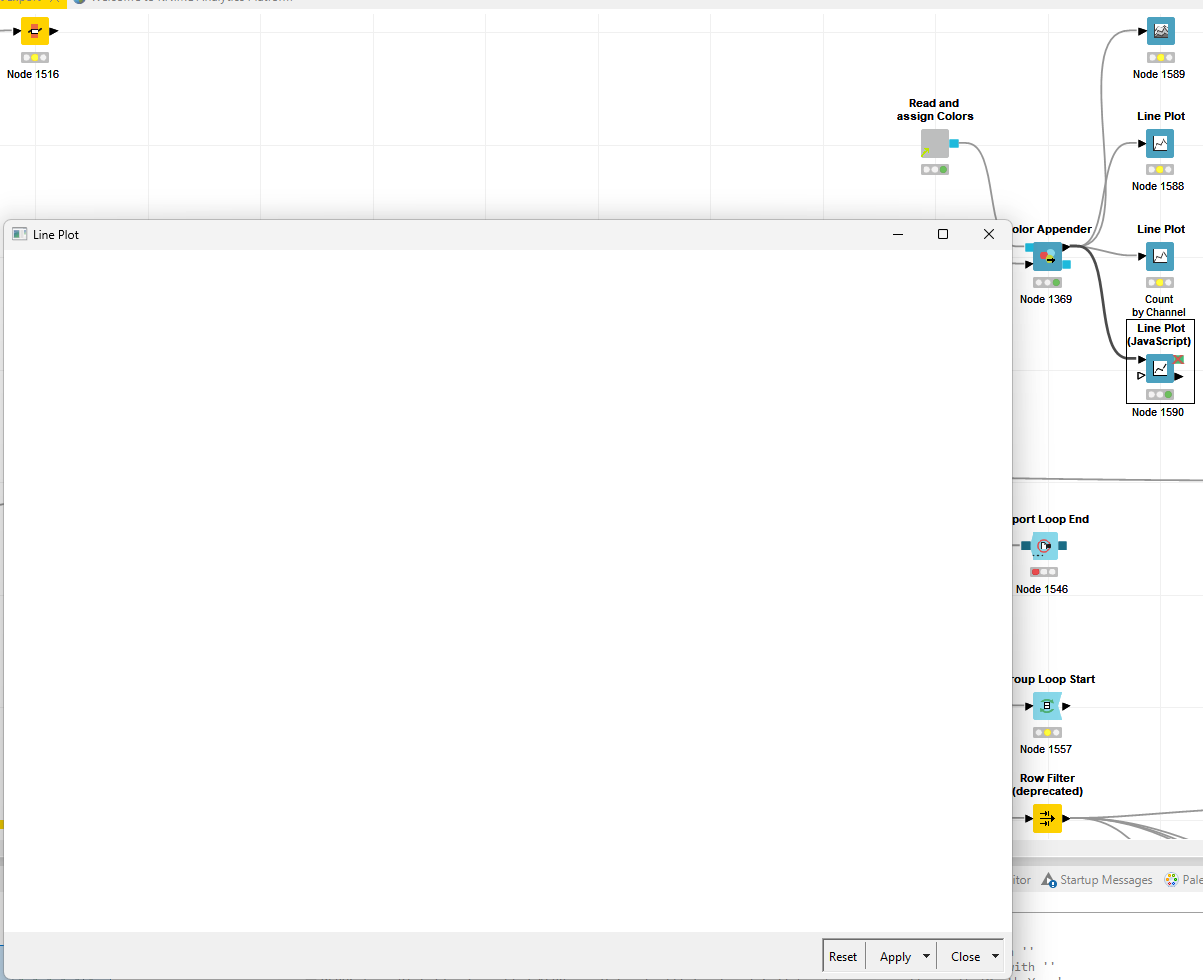
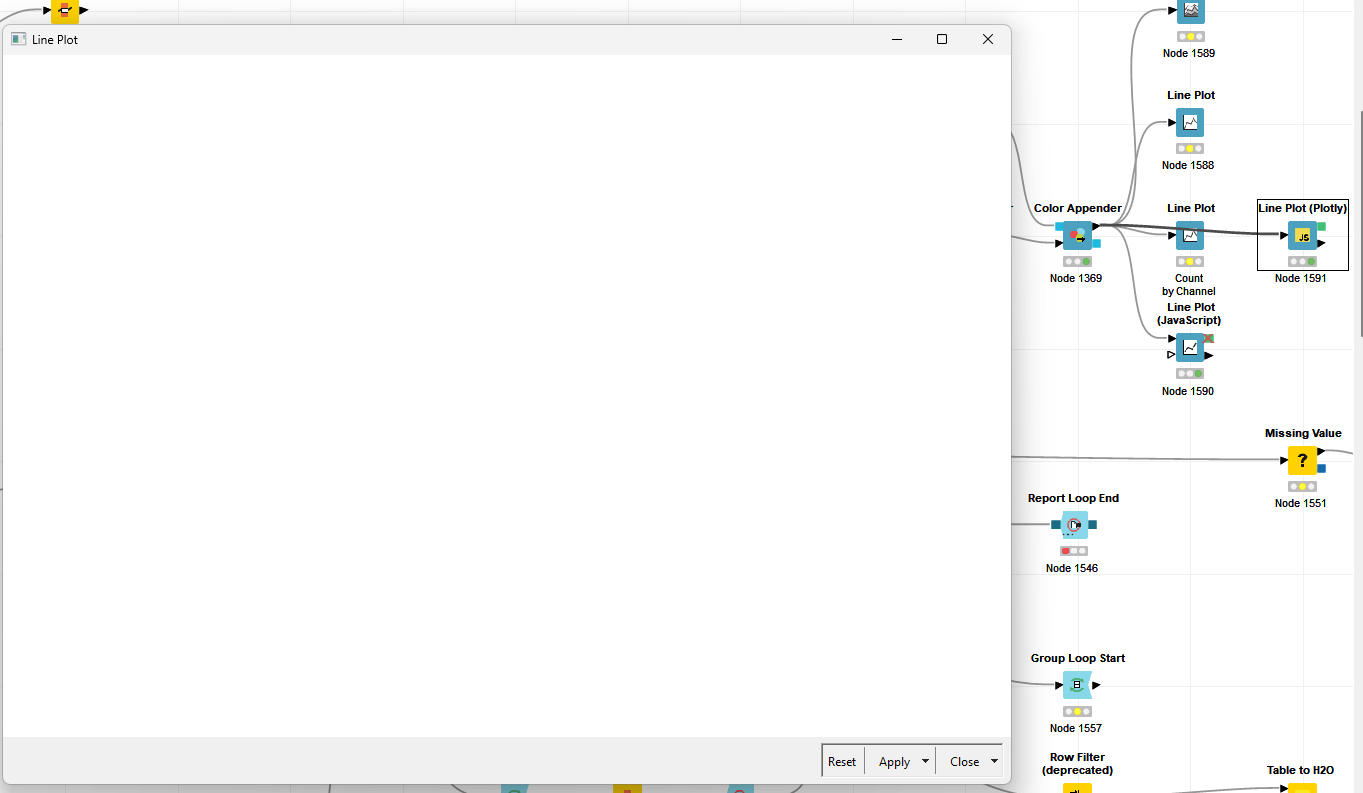
since updating from 5.2 to 5.3 I noticed none of the chart nodes, even the JS-based
or Plotly ones, render anything. There is no error in the console, though.
However, the image generation seems to work
Best
Mike
Hey,
this is very likely the same problem as described here. There is currently a problem with the views/dialogs if you start with classic UI. Workaround is to either use modern UI or switch to modern ui and back. Afterwards, everything should work as expected. We are currently investigating the issue.
Greetings and sorry,
Daniel
Ugh, that hurts … is that caused by updating 5.2 instead of a fresh install?
Hey,
sadly not. This is also the case for fresh installs.
Greetings,
Daniel
How did we missed that during the community hacking days? I explicitly checked the chart nodes and interactive view.
Internal ticket ID: NXT-2747
Fix version(s): 5.3.1
Other related topic(s): -