Since Alteryx is more or less a glorified wrapper for R code ![]() why not configure something (using this example) with the help of a KNIME component (other data of that kind should also work if you configure them):
why not configure something (using this example) with the help of a KNIME component (other data of that kind should also work if you configure them):
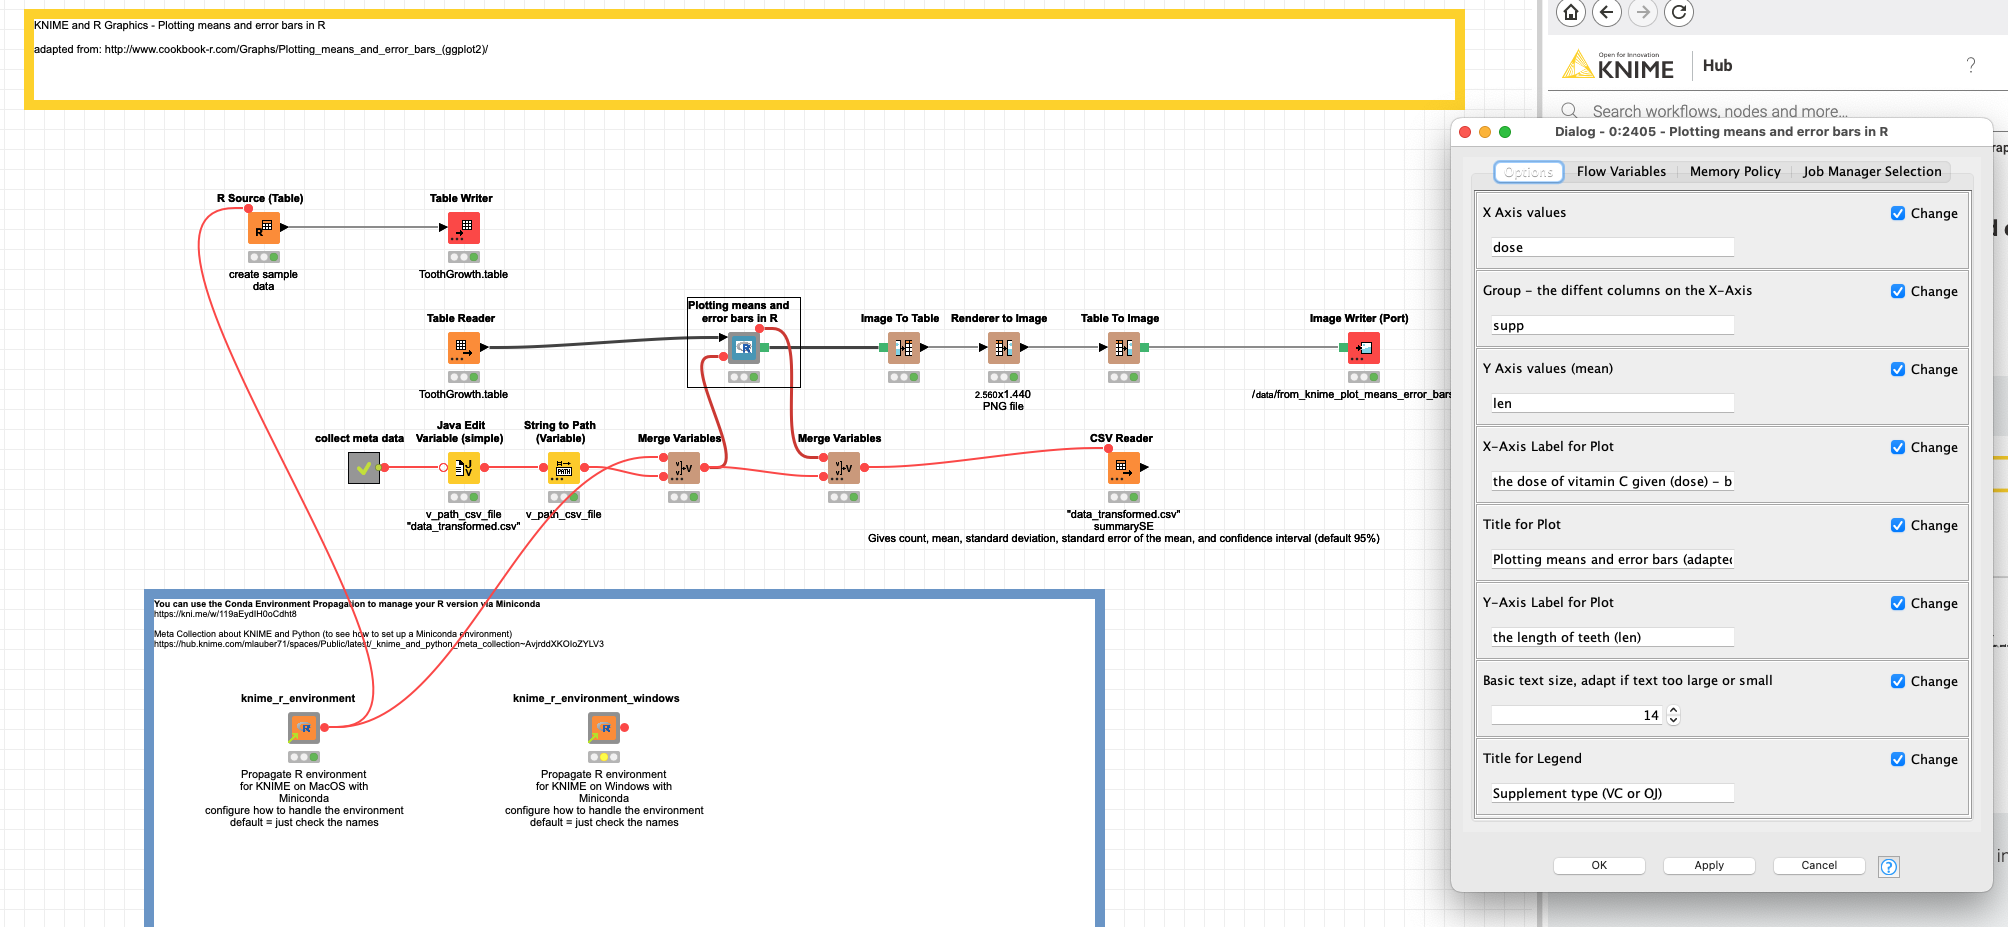
You could edit the settings of the columns and the component should do the rest. You will have to set up KNIME and R and you might have to install some packages. I might have to tweak the workflow some and there is a bug in the R and MacOSX environment propagation.
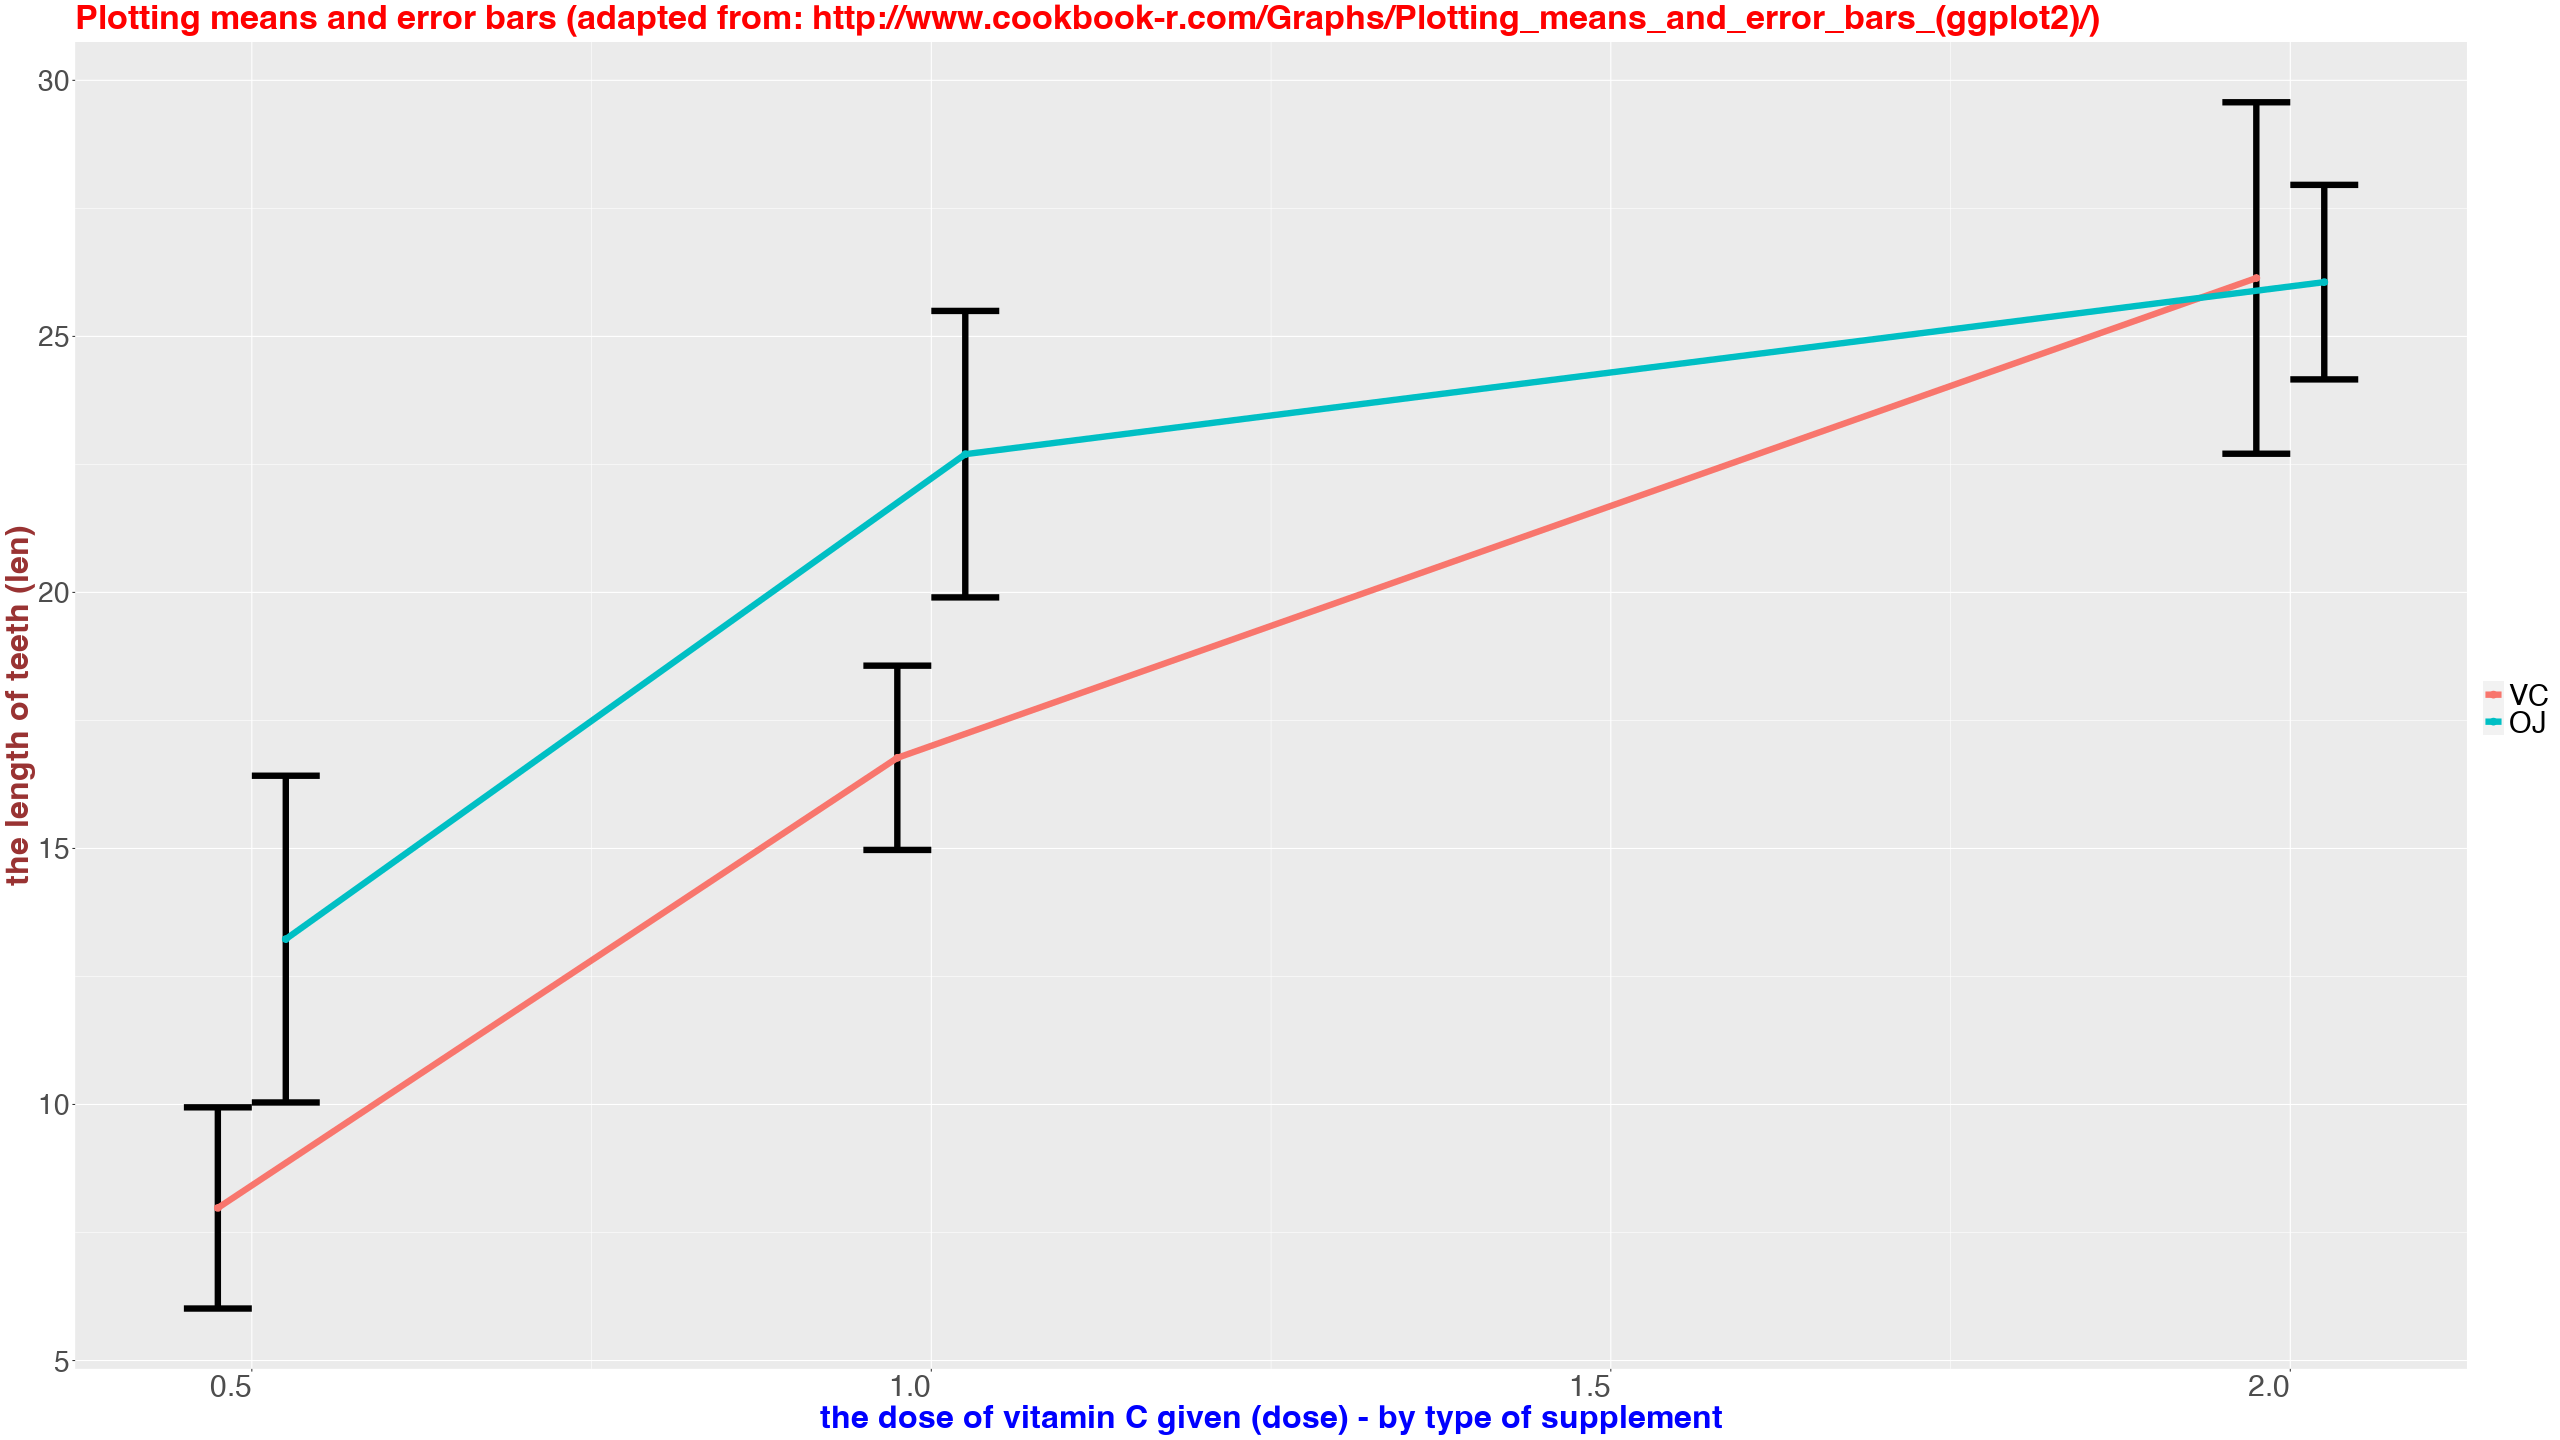
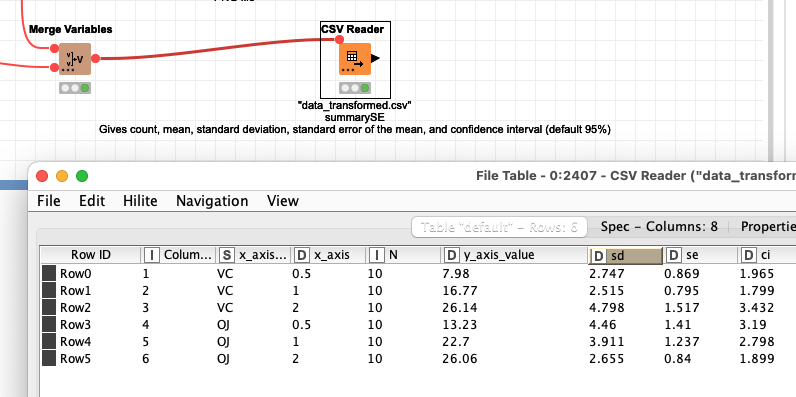
The workflow will also output the aggregated descriptions used to create the graphic.
More examples with the use of KNIME graphics and components you can find with Python and R/RStudio on the hub.
If you are interested in a more complicated violin plot giving you all the statistics to compare numeric variables by groups you might want to check this example: