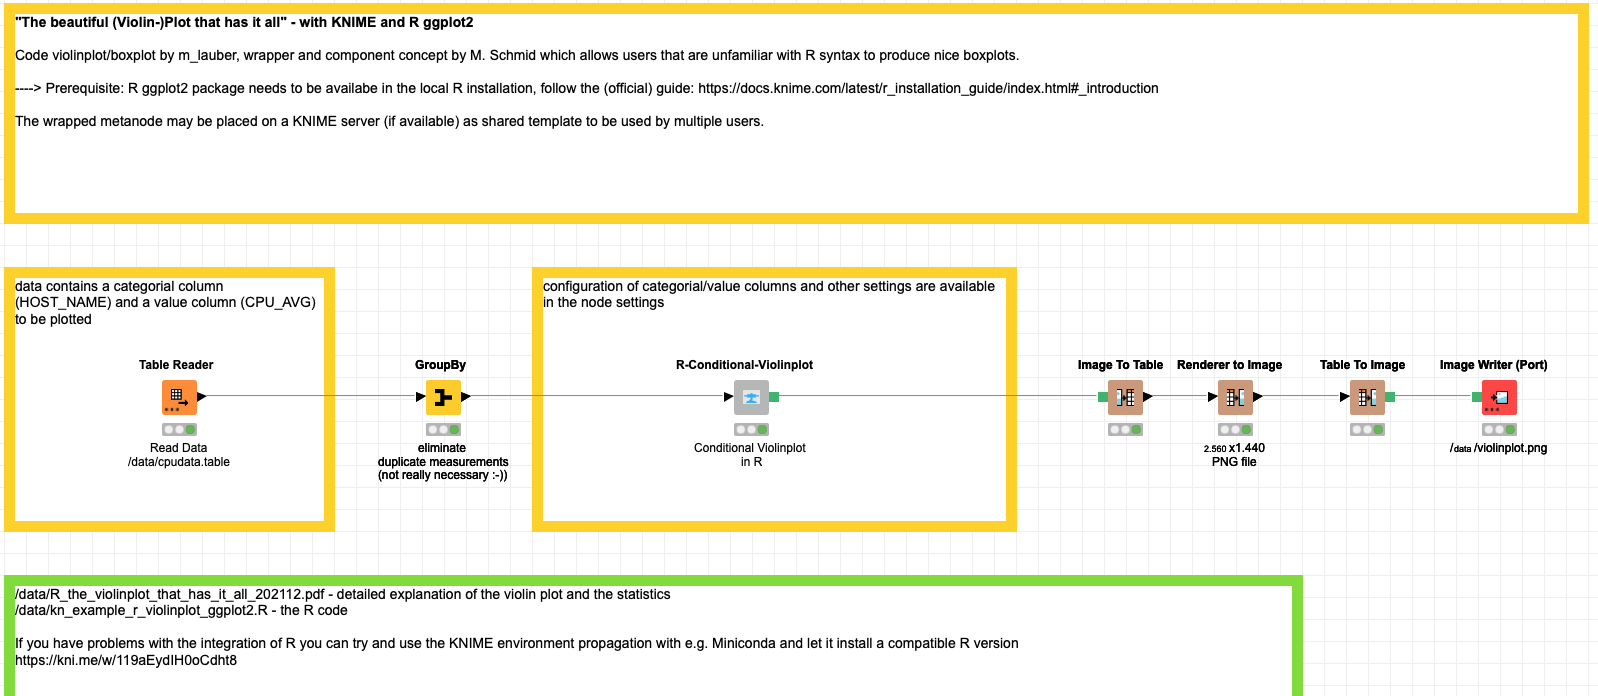
With the help of KNIME components and the R (collection R | official R) package ggplot2 you could create a violin plot with a lot of additional statistics in one chart. The KNIME component makes it easy to configure the options even if you are not familiar with R code.
Violin plots are very effective to show the structure of numeric variables and compare them across different groups. Their width represents the number of cases that would have the values on the y-axis. It is widely used e.g. as a population pyramid.
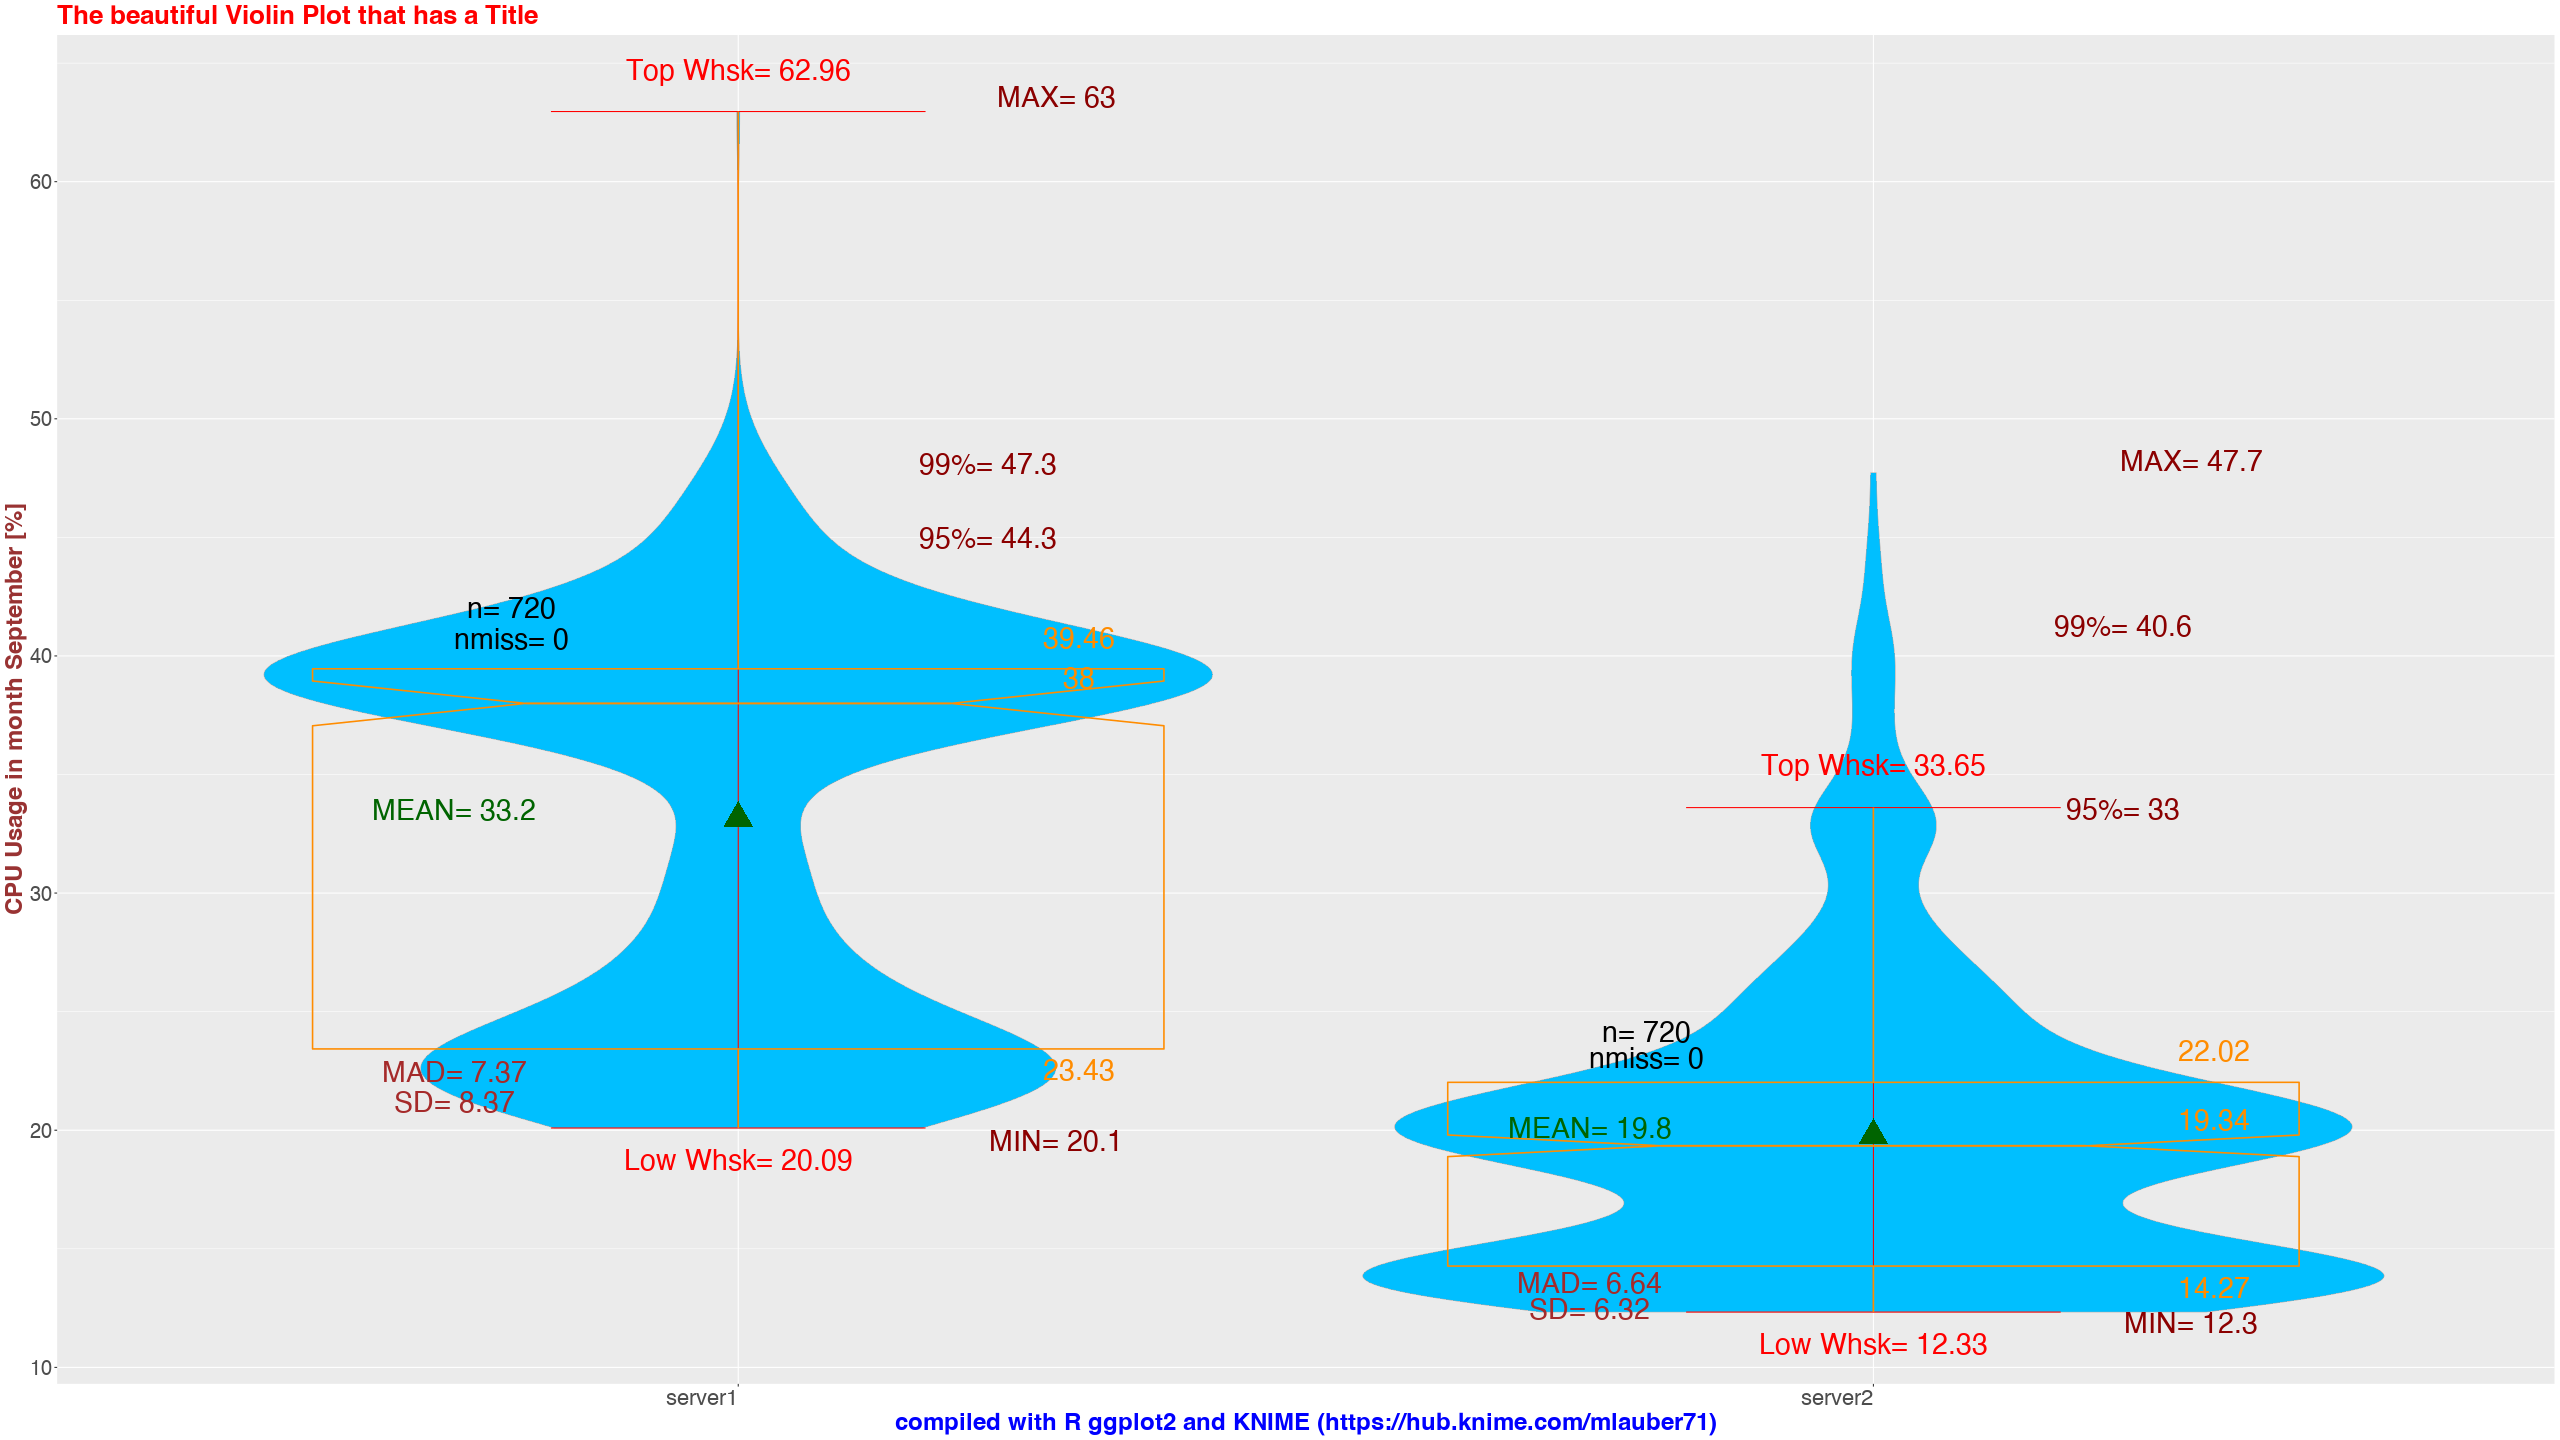
In this case we see the usage of a CPU in % in time intervals over one month (on the y-axis) compared between two servers (x-axis). Question is which server is more heavily used and how would the usage spread over the levels of usage.
The R package ggplot2 now offers a lot of visualizations and configurations that you could combine into one integrated view.
The code has been composed and collected by me and the basic version of the component has been created by M. Schmid. I have expanded it to give you access to a lot of useful statistics to describe the two data sets.
But in the end, you might as well just compare the shape of the violins to get an idea about the differences and the structure of the numbers or as D. Paurat would put it: “the eyes have it”.
If you look at the stats you have the classic boxplot statistics like quartiles, mean, median; you have extremes and information about the deviation of the values.

The usage of the component is quite simple. You have a numeric column (y) you want to explore and a column with categories (x) you want to compare (or just show one).
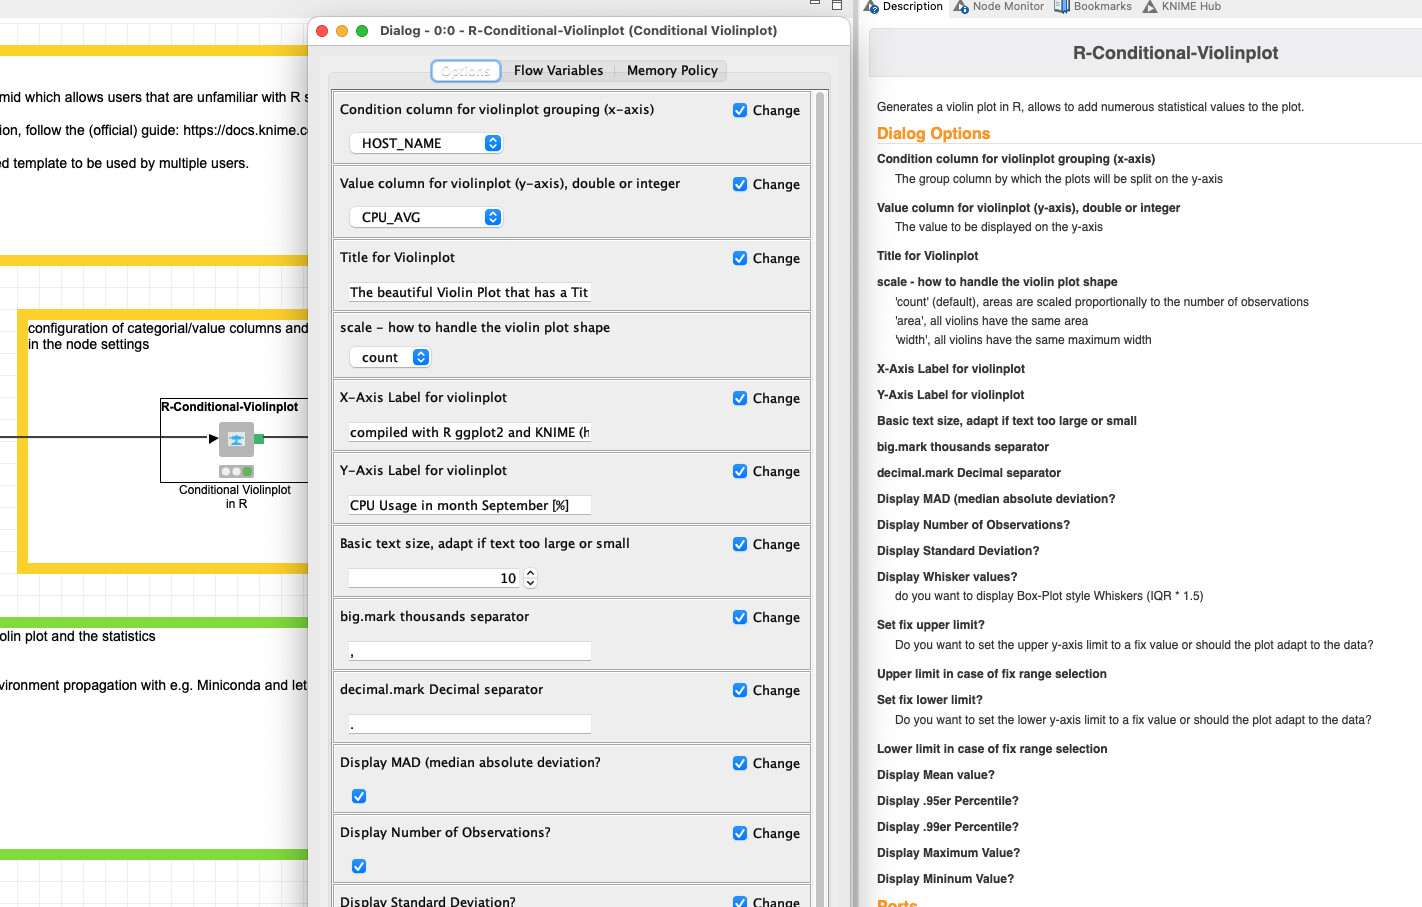
The items in the plot can be configured in the menu of the component (just right click) like the columns to compare, the titles (of the axis) and text sizes. One basic configuration would be how you want the violine’s shape to handle the number of items. My standard is to have the shapes proportional to the number of cases “count”. But a legitimate case can be made for all these settings (if you focus on the comparison of the shapes):
- ‘count’ (default), areas are scaled proportionally to the number of observations
- ‘area’, all violins have the same area
- ‘width’, all violins have the same maximum width
The graphic is being exported as a PNG file for further usage.
If you are interested in the R code inside a few hints:
Most of the ‘magic’ is to use “fun.data” specific functions on the Aesthetics data structure of the plot (https://ggplot2.tidyverse.org/reference/stat_summary.html). The result would contain the values formatted with decimal and thousands separators, an indicator like “MAX=” and also a position where to put the label. The label is deliberately put a little bit off the value itself so not to block any information.
If you decide to have the number of missing values displayed the label will be put just on top of the boxplot (75er quartile) and will be ‘styled’ with the help of prettyNum(bers)

Also, the result will be moved slightly to the left of the middle. All positions will be dynamically generated and moved according to the values that come in. So, if all does work you would not have to worry about the position of your stats and labels. You can also nudge it slightly to not overlap text/labels.
The R code is also provided in the “/data/” subdirectory of the workflow.